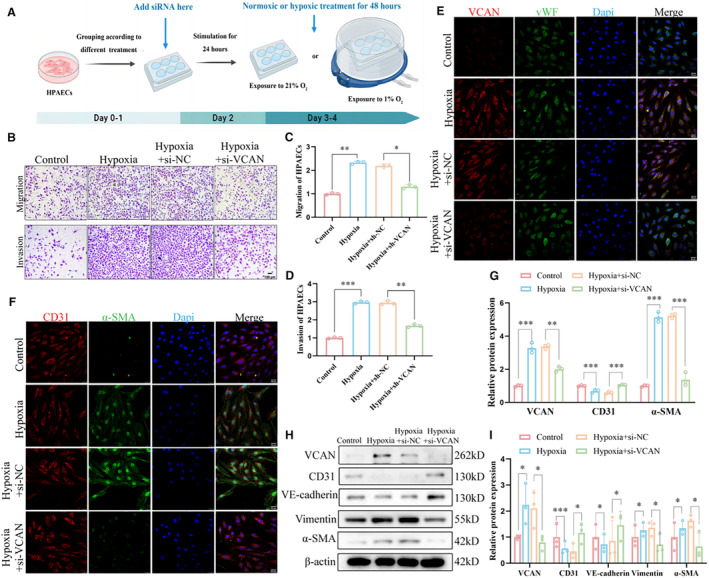
Figure 4. Knockdown of VCAN inhibited hypoxia‐induced EndMT in vitro.

A, The workflow diagram of the in vitro experiment. (B–D) Representative images and densitometric quantification of migration and invasion assay of HPAECs (n=3). ×100, scale bar: 100 μm. ***P<0.001. (E) Co‐immunostaining of VCAN (red) with vWF(green) was performed in HPAECs (n=3). ×400, scale bar: 25 μm. (F) Co‐immunostaining of CD31 (red) with α‐SMA (green) was performed in HPAECs (n=3). ×400, scale bar: 25 μm. (G) Densitometric fluorescence intensity of VCAN, CD31, and α‐SMA in (4F and 4G) (n=3). **P<0.01, ***P<0.001. (H and I) The protein levels and densitometric quantification of VCAN, CD31,VE‐cadherin, vimentin, and α‐SMA were determined by Western blot analysis after different treatment (n=3). *P<0.05, ***P<0.001. ANOVA with the Tukey test was performed for comparison between 4 groups. CD31 indicates platelet endothelial cell adhesion molecule‐1; EndMT, endothelial‐to‐mesenchymal transition; H&E, hematoxylin–eosin; HPAECs, human pulmonary artery endothelial cells; siRNA, small interfering RNA; VCAN, versican; VE‐cadherin, vascular endothelial cadherin; vWF, von Willebrand factor; and α‐SMA, α‐smooth muscle Actin.
