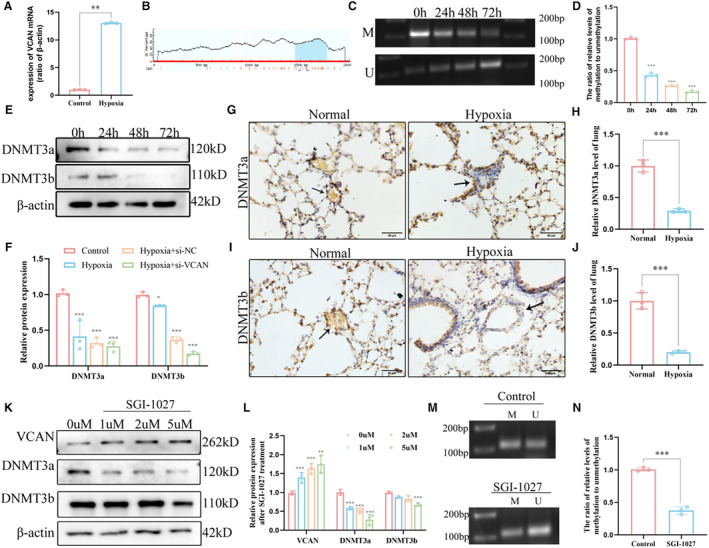
Figure 6. Downregulation of DNA methyltransferase expression and promotion of VCAN through promoter hypomethylation.

A, RT‐qPCR analysis of the mRNA level of VCAN from HPAECs (n=3). **P<0.01. (B) CpG sites of the promoter of VCAN gene. (C and D) DNA methylation levels of the VCAN promotor region in HPAECs and corresponding densitometric quantification as detected by MSP assay (n=3). ***P<0.001. (E and F) The protein levels and densitometric quantification of DNMT3a and DNMT3b were determined by Western blot analysis after the hypoxia treatment (n=3). *P<0.05, ***P<0.001. (G–J) Representative images of immunohistochemical staining confirmed that DNMT3a and DNMT3b were significantly decreased in HPH mice compared with the normal control group (n=3). Positive staining was indicated by a brown color and pointed out with black arrow. ×400, scale bar: 50 μm. ***P<0.001. (K and L) The protein levels and densitometric quantification of DNMTs and VCAN levels in SGI‐1027‐treated HPAECs (n=3). **P<0.01, ***P<0.001. (M and N) DNA methylation levels of the VCAN promotor region in 5 μM SGI‐1027‐treated HPAECs and corresponding densitometric quantification as detected by MSP assay (n=3). ***P<0.001. An unpaired 2‐tailed Student t test was performed for comparisons between 2 groups. CpG indicates Cytosine‐phosphate‐Guanine; DNMT, DNA methyltransferase; HPAECs, human pulmonary artery endothelial cells; HPH, hypoxia‐induced pulmonary hypertension; MSP, methylation‐specific polymerase chain reaction; RT‐qPCR, reverse transcription‐quantitative polymerase chain reaction; and VCAN, versican.
