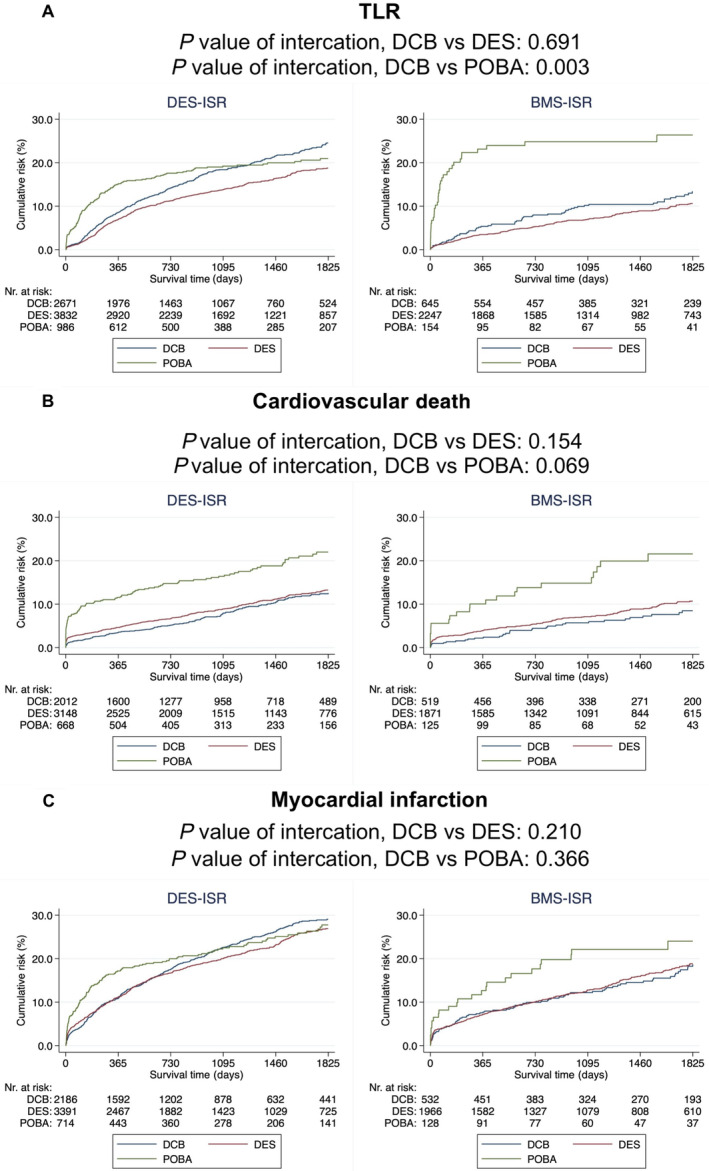
Figure 4. DES‐ISR and BMS‐ISR stratification.

Kaplan–Meier curves illustrating the event rate of (A) TLR, (B) cardiovascular death, and (C) myocardial infarction. P value of interaction was also calculated using an adjusted* Cox proportional hazard model. *Adjusted for: inclusion year, age, sex, smoking status, diabetes mellitus, hypertension, hyperlipidemia, previous heart failure, renal failure, previous myocardial infarction, previous coronary artery by‐pass graft surgery, indication, number of lesions with ISR, lesion location, use of IVUS or OCT, ACC/AHA lesion classification, ISR type (DES‐ISR vs BMS‐ISR), number of previous stents in target lesion (single vs multiple) and time to ISR (Early ISR [<31 days] vs late ISR [31–365 days] vs very late ISR [>365 days]). ACC/AHA indicates American College of Cardiology/American Heart Association; BMS, bare‐metal stent; CAD, coronary artery disease; DCB, drug‐coated balloon; DES, drug‐eluting stent; HR, hazard ratio; ISR, in‐stent restenosis; POBA, plain old balloon angioplasty; and TLR, target lesion revascularization.
