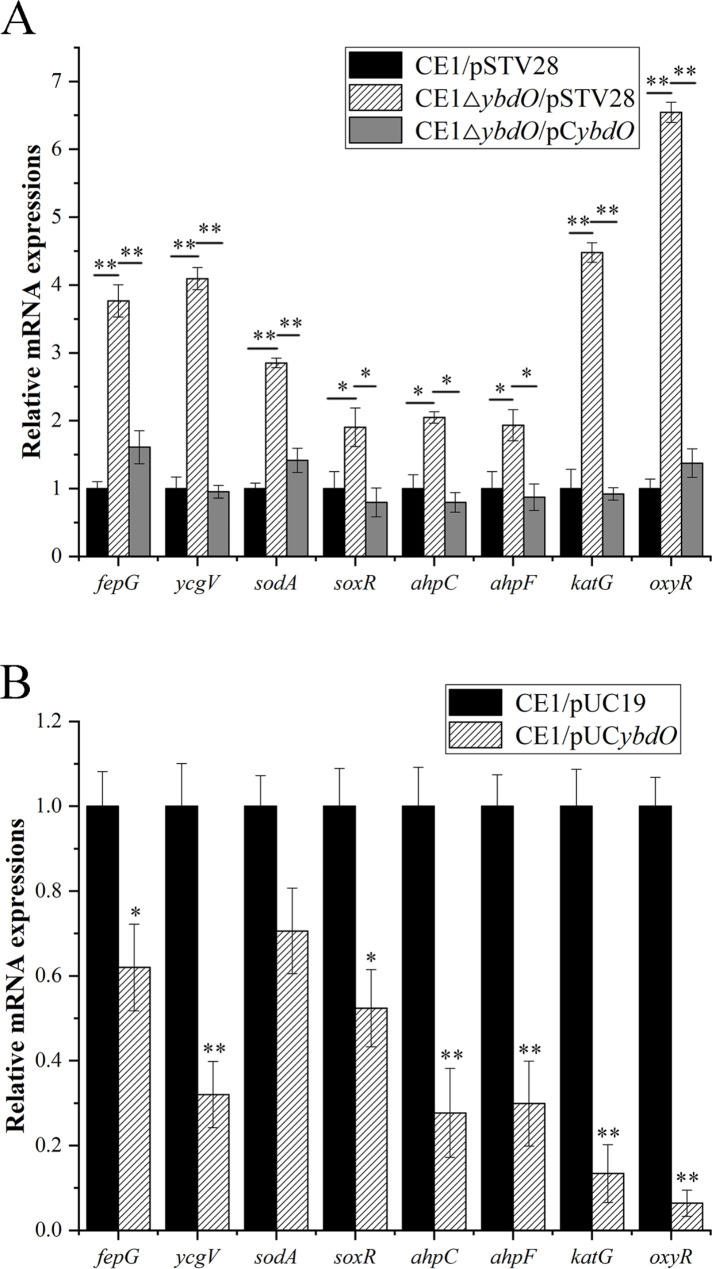
Fig. 3.
Relative mRNA expressions of virulence genes and oxidative stress response genes by RT-qPCR in CE1/pSTV28, CE1ΔybdO/pSTV28, CE1ΔybdO/pCybdO, CE1/pUC19, and CE1/pUCybdO. (A) Relative transcription levels of fepG, ycgV, sodA, soxR, ahpC, ahpF, katG, and oxyR were determined by RT-qPCR in CE1/pSTV28, CE1ΔybdO/pSTV28, and CE1ΔybdO/pCybdO cultured in LB broth with 16 μg/mL chloramphenicol. (B) Relative transcription levels of fepG, ycgV, sodA, soxR, ahpC, ahpF, katG, and oxyR were determined by RT-qPCR in CE1/pUC19 and CE1/pUCybdO cultured in LB broth with 100 μg/mL ampicillin. Error bars indicate standard deviations. The relative gene expressions were calculated using the 2−ΔΔCt method. **P < 0.01, indicating the extremely significant difference; *P < 0.05, indicating the significant difference

