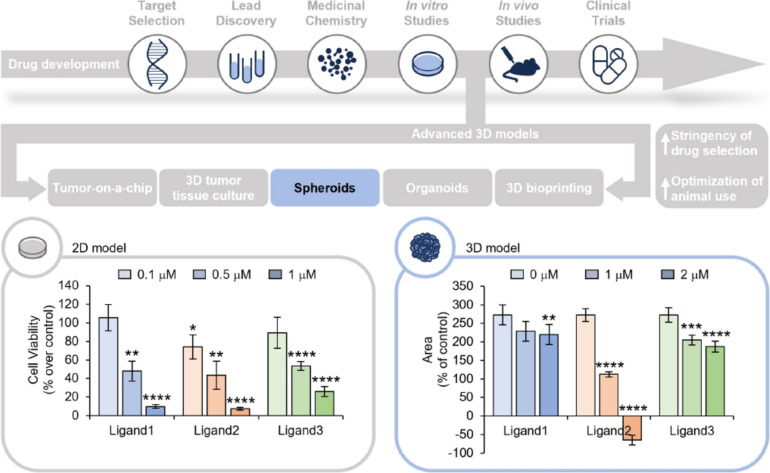
Fig. 10.
Upper panel. Schematic representation of drug development process. Bottom panels. Left panel: 2D cell viability assays performed after 48 h of treatment with the indicated compounds, at the final concentrations of 0.1, 0.5 and 1 μM. The results are expressed as the percentage of cell viability over the untreated cells. The histogram represents the mean values ± S.D. of three independent experiments. Right panel: Time course analysis of 3D tumor spheroids growth. Two days after the plating, the spheres were treated with the indicated compound at the final concentrations of 1 and 2 μM and monitored by Incucyte® S3 Live-Cell Analysis System (Essen BioScience, Ann Arbor, MI), 4X magnification. The results are expressed as the percentage of the spheroids area upon treatment relative to their own area before the compound administration. The graphs represent the mean values ± S.E.M. of at least 4 spheres. For each graph: *p < 0.05, **p < 0.01, ***p < 0.001, ****p < 0.0001

