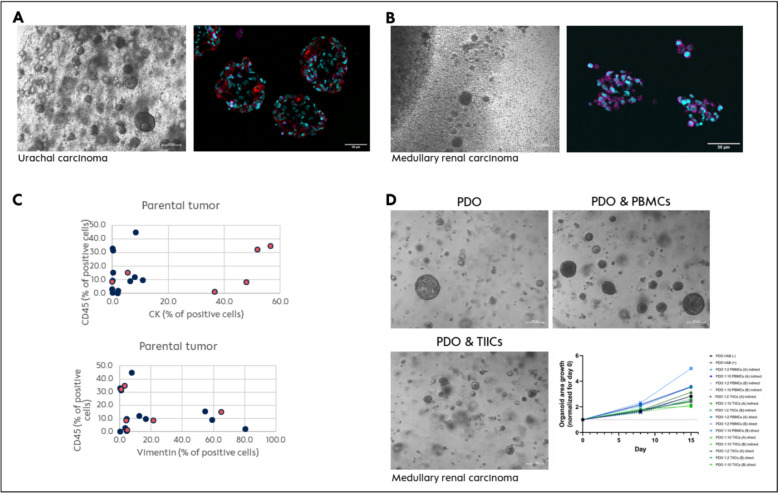
Fig. 6.
TIICs expansion and characterization. A Images representative of one Urachal carcinoma sample mPDO in brightfield and multiplex immunofluorescence (3D passage 1); depicted are cytokeration-7 (red), αSMA (green) and CD45 (magenta). B Images representative of one renal medullary carcinoma sample TIICs in brightfield and multiplex immunofluorescence (passage 1 and 3, respectively); depicted are cytokeration-7 (red), αSMA (green) CD45 (magenta). C Graphical representation of the proportion of cells positive for CD45, Vimentin and Cytokeratin within the parental tumor sample processed analysed via multiplex immunofluorescence. Coral colouring marks the tumours showing TIICs expansion. D Co-culture conditions tested for the medullary renal carcinoma cPDO with autologous PBMCs and TIICs with graphical representation of the organoid growth

