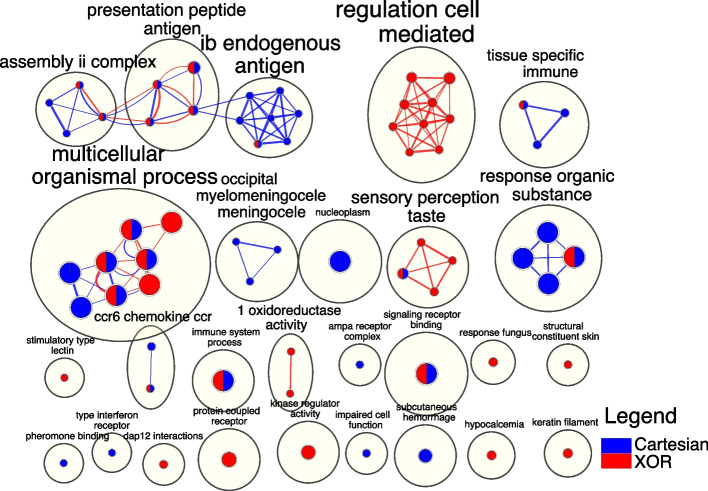
Fig. 6.
The EnrichmentMap depicts a network of terms extracted from SNPs within different epistatic networks (interaction models). Nodes correspond to biological terms generated from g:Profiler, while edges denote shared genes between terms. AutoAnnotate is employed to aggregate strongly interconnected nodes using cycles, with the theme of the enclosed terms delineated beside each cycle. The node size and edge thickness are proportionate to the gene count they represent. The origin of nodes and edges is indicated by a color coding scheme, where blue denotes origination from Cartesian and red from XOR

