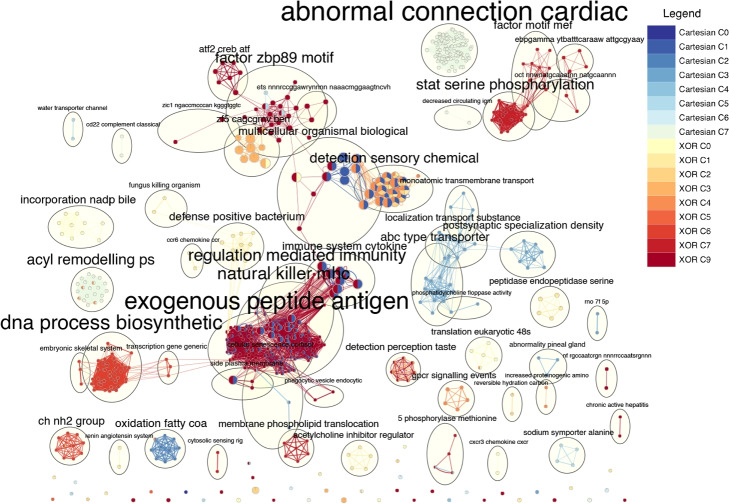
Fig. 7.
The EnrichmentMap portrays a community-scale comparison of terms derived from SNP communities within distinct epistatic network models. Nodes symbolize biological terms generated from g:Profiler and edges signify the shared genes among these terms. AutoAnnotate clusters closely linked nodes into communities, with each cluster’s overarching theme inscribed beside the cycle. Node size and edge breadth are scaled to the quantity of genes they signify. The origin of nodes and edges is depicted with colors shown in the legend

