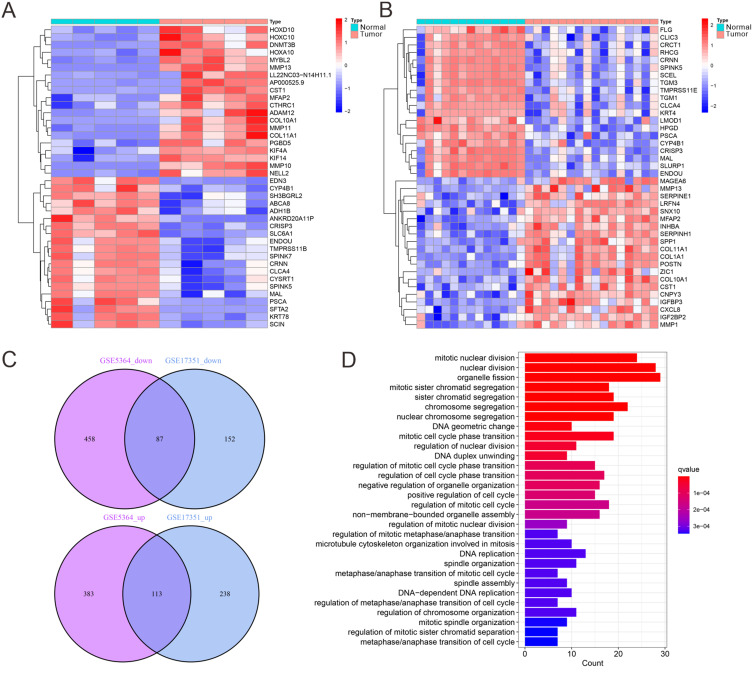
Figure 1.
DEG expression analysis. (A) Heatmap analysis of the top 20 DEGs based on the GSE5364 dataset (Normal = 13, Tumor = 16). (B) Heatmap analysis of the top 20 differential genes based on the GSE17351 dataset (Normal = 5, Tumor = 5). (C) Venn diagram of the DEGs in GSE5364 and GSE17351 datasets. (D) KEGG pathway enrichment analysis.

