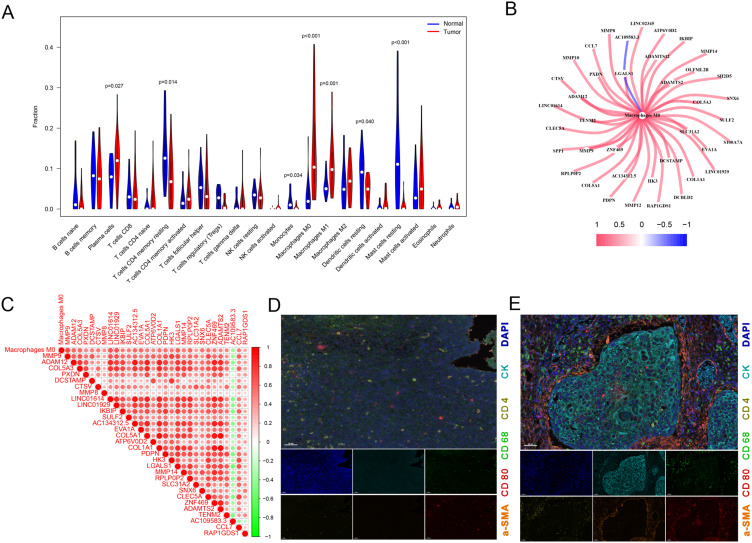
Figure 2.
M0MRG analyses. (A) Immune cell infiltration analysis in GSE5364 and GSE17351 datasets by CIBERSORT. (B) Co-expression network diagram of M0MRGs. (C) Heatmap of M0MRGs expression. (D and E) MP-IHC staining for normal esophageal tissues (D) vs ESCA tissues (E). Pan-macrophages: CD68; M1 macrophages cells: CD80; α-smooth muscle actin: α-SMA; tumor: CK.

