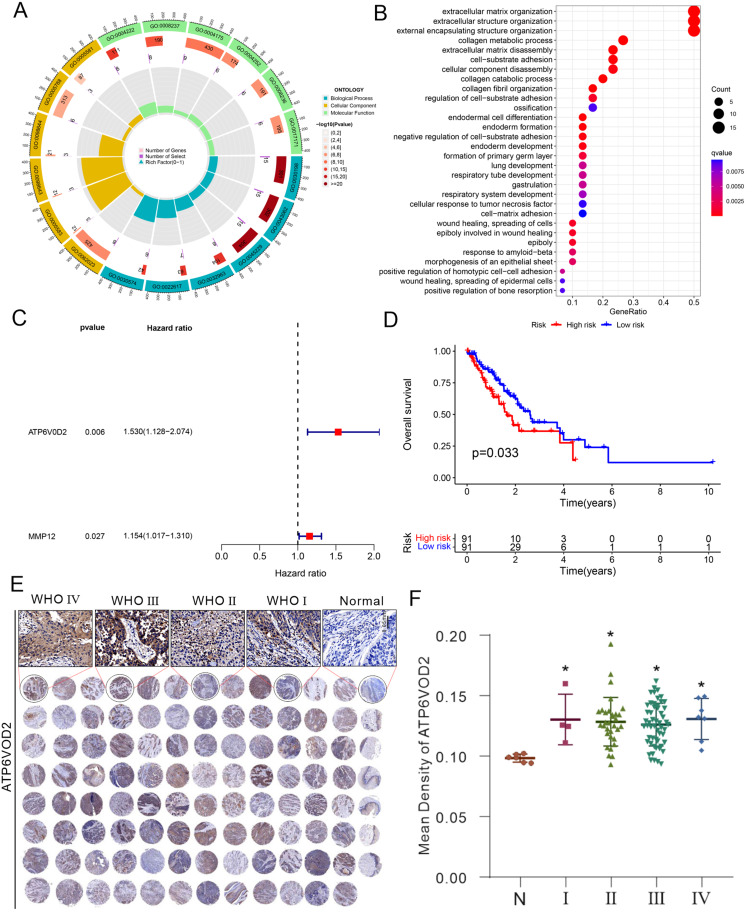
Figure 3.
Construction of a prognostic signature based on M0MRGs. (A) GO analysis and (B) KEGG pathway enrichment analysis of M0MRGs. (C) Multivariate prognostic analyses of M0MRGs. (D) Stratified survival analysis according to risk grouping. (E and F) Detection of ATP6V0D2 expression using tissue microarray and immunohistochemical staining. N: Normal (n = 6), I: WHO I (n = 4), II: WHO II (n = 32), III: WHO III (n = 54). IV: WHO IV (n = 7). ATP6V0D2 expression in different grades of ESCA tissues was detected, with normal tissues as the control. * P < 0.05 by one‐way analysis of variance with Tukey’s test.

