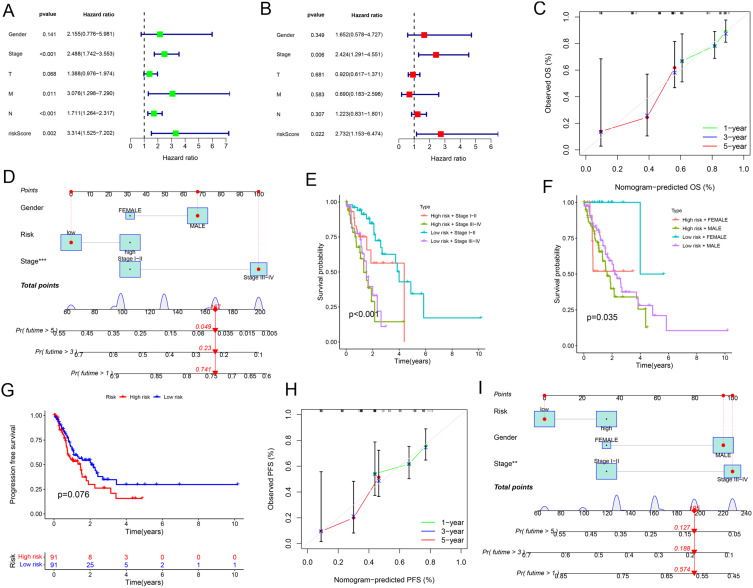
Figure 4.
Independent prognostic analysis of risk scores and clinical parameters. (A) Univariate independent prognostic analysis of ESCA. (B) Multivariate independent prognostic analysis of ESCA. (C) Calibration curves for the overall survival. (D) Nomogram for predicting overall survival (predicting 1-year, 3-year, and 5-year). Red line: Represents the prediction trajectory corresponding to the specific variable values of an individual patient. Blue box: Represents the score range corresponding to the variable values, indicating the contribution of different variable values to the model. Probability density curve: Represents the distribution trend of variable values in the sample data, with peaks indicating the common value range of the variable. (E and F) Survival prediction by clinical parameters and risk scores. (G) PFS curves of patients with ESCA. (H) Calibration curves for the PFS nomogram. (I) Nomogram for predicting PFS (predicting 1-year, 3-year, and 5-year).
Abbreviations: T, Tumor; M, Metastasis; N, Node.

