Figure 7.
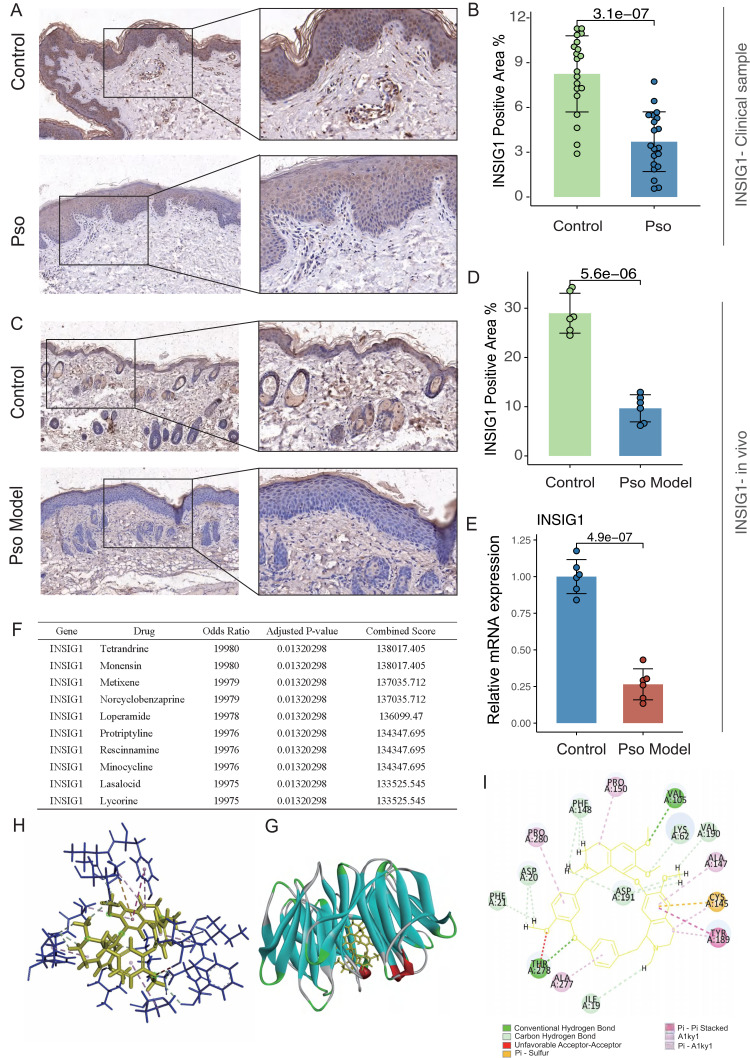
Validation of INSIG1 expression in psoriasis through experiments and molecular docking results between INSIG1 and tetrandrine. (A and B) IHC results of INSIG1 expression in the Pso group compared with the Control group in clinical samples (n=20) and (C and D) in in vivo (n=6) experiments (scale bar = 50 μm and 20 μm). (E) mRNA expression level of INSIG1 in the Pso model group compared with the control group in vivo (n=6). (F) Drug sensitivity enrichment analysis of INSIG1. (G and H) Visualization of molecular docking between INSIG1 and tetrandrine. (I) Results of interaction analysis between ligand (tetrandrine) and receptor (INSIG1). Statistical significance: *p < 0.05, **p < 0.01, ***p < 0.001, ****p < 0.0001, compared with the Control group.

