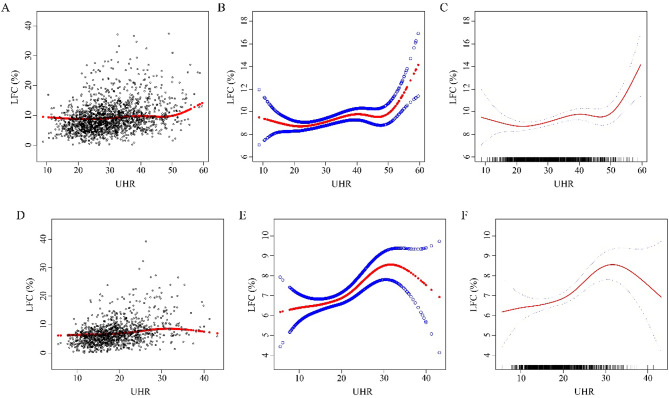
Figure 2.
Relationship between UHR and LFC (%). A - C for male, D - F for female. A and D: Each black hollow point exhibits one participant. B, C, E, and F: Solid red line illustrates the fitted smooth curve among variables. Age, nationality, BMI, SBP, DBP, TC, TG, LDL-C, TP, Hb, ALT, AST, ALP, GGT, FBG, and serum creatinine were adjusted.

