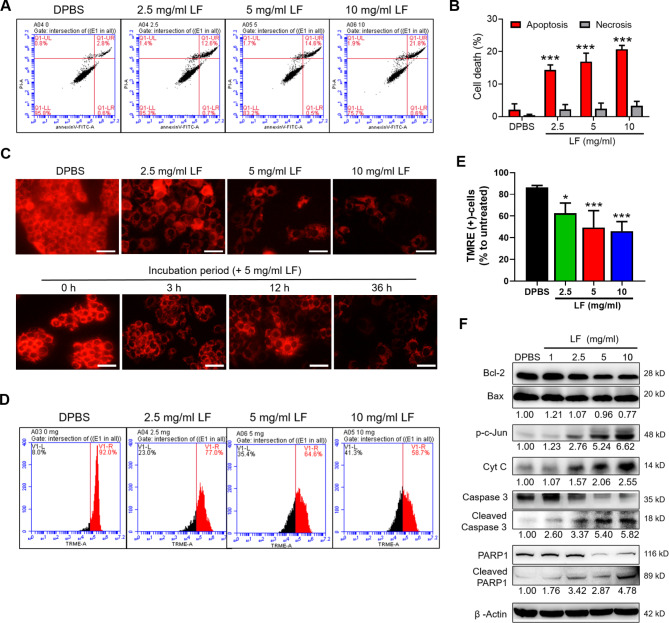
Fig. 2.
LF induces mitochondrial-mediated apoptosis in HepG2 cells. (A) Representative flow cytometric analysis of apoptosis. After being exposed to LF for 48 h, HepG2 cells were stained with Annexin V-FITC antibodies and PI and then subjected to apoptotic analysis using flow cytometry. (B) The proportions of apoptotic and necrotic HepG2 cells after LF treatment. (C) Representative fluorescence images of the mitochondrial membrane potential assay. In this experiment, HepG2 cells with normal mitochondrial membrane potential were labeled with TMRE (red fluorescence). Scale bars, 50 μm. (D) Representative flow cytometric analysis of TMRE-labeled HepG2 cells. (E) The proportion of TMRE-positive HepG2 cells in the mitochondrial membrane potential assay using flow cytometry. (F) Western blot analysis of apoptosis-related proteins. The relative protein levels are shown below the representative images, which were determined after normalization and comparison with the DPBS-treated HepG2 lysates. Statistical significance: * (p < 0.05), ** (p < 0.01), and *** (p < 0.001) vs. DPBS.

