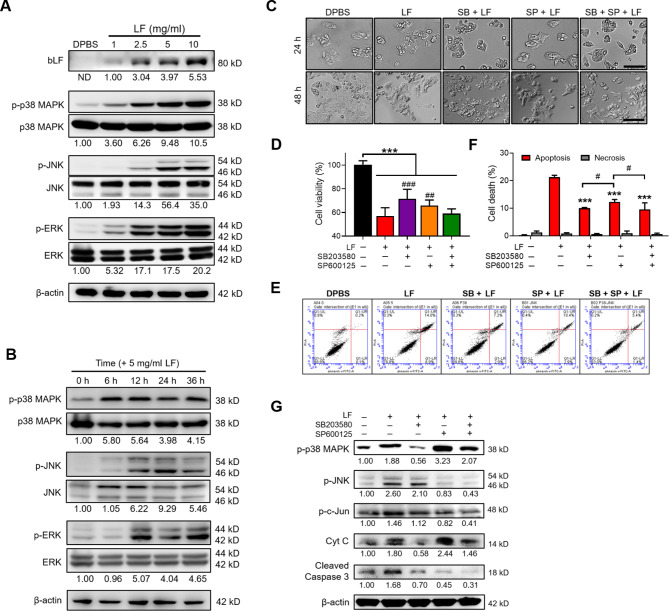
Fig. 3.
LF induces cell apoptosis through the activation of p38 MAPK and JNK signaling. (A) Western blot images showing the entry of LF and the effects of LF treatment for 48 h on p38 MAPK, JNK, and ERK phosphorylation. The relative phosphorylated profiles shown below were determined by normalizing the phosphorylated protein intensity to the unphosphorylated protein intensity and comparing them with the DPBS-treated HepG2 lysates. ND means that the band intensity was not detectable. (B) Western blot images showing the time-course of p38 MAPK, JNK, and ERK phosphorylation after 5 mg/ml LF treatment. (C) Representative cell images at 24 and 48 h after treatment with LF (5 mg/ml) and inhibitors against p38 MAPK (SB203580) and JNK (SP600125). Scale bars, 100 μm. (D) Cell viability after treatment with LF and inhibitors (*, vs. no LF; #, vs. LF/no inhibitors). (E) Representative apoptosis analysis after treatment with LF and inhibitors. (F) The proportions of apoptotic and necrotic HepG2 cells after treatments with LF and inhibitors (*, vs. LF/no inhibitors). (G) Western blot images showing the changes in p38 MAPK and JNK phosphorylation and the release of cytochrome C and cleaved caspase 3 after treatment with LF and inhibitors. The relative protein levels were determined after β-actin normalization. Statistical significance: * (p < 0.05), ** (p < 0.01), and *** (p < 0.001); # (p < 0.05), ## (p < 0.01), and ### (p < 0.001).

