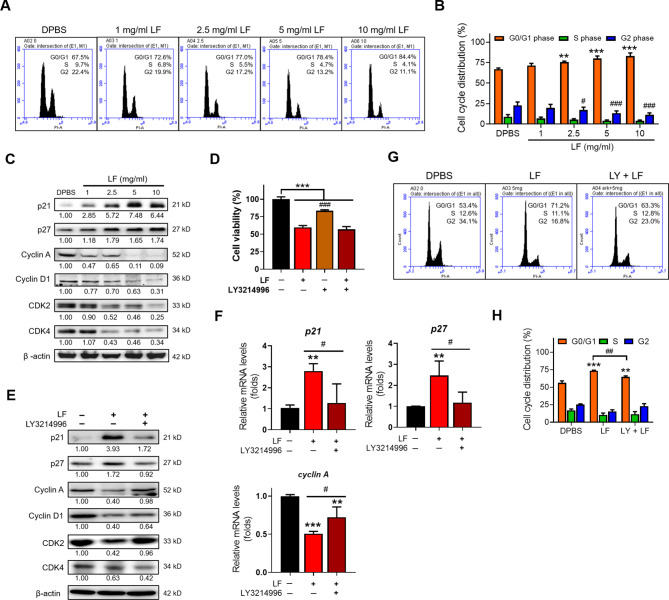
Fig. 4.
LF arrests the HepG2 cell cycle at the G0/G1 phase through the activation of ERK signaling. (A) Representative flow cytometric analysis of the HepG2 cell cycle. (B) The proportions of HepG2 cells at different phases of the cell cycle (*, vs. G0/G1 phase/DPBS; #, vs. G2 phase/DPBS). (C) Western blot analysis of cell cycle-related proteins. The relative protein levels were determined after β-actin normalization. (D) Cell viability after treatment with LF and ERK inhibitor (LY3214996) (# vs. LF/no inhibitor). (E) Western blot images showing the changes in cell cycle-related proteins after treatments with LF and LY3214996. (F) Quantitative RT‒PCR analysis showing the changes in p21, p27, and Cyclin A mRNA levels after treatments with LF and LY3214996 (*, vs. no LF). (G) Representative cell cycle analysis after treatment with LF and LY3214996. (H) Changes in the cell cycle distribution after treatment with LF and LY3214996 (*, vs. G0/G1 phase/DPBS). Statistical significance: * (p < 0.05), ** (p < 0.01), and *** (p < 0.001); # (p < 0.05), ## (p < 0.01), and ### (p < 0.001).

