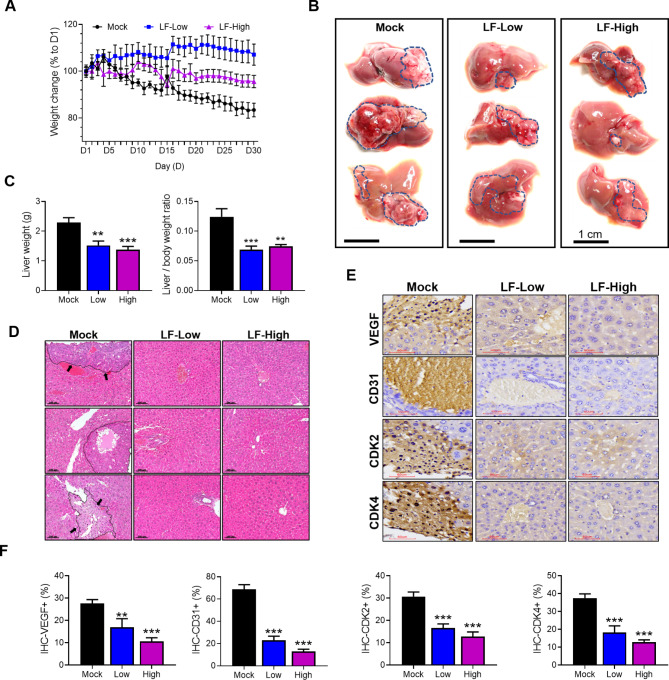
Fig. 6.
LF exerts anti-HCC effects on mice. (A) Changes in mouse body weight during oral administration of PBS (Mock), 100 mg/kg/day LF (LF-Low), or 200 mg/kg/day LF (LF-High). (B) The appearance of the whole liver at the end of oral administration (each n = 3). (C) Comparison of liver weight and the liver-to-body weight ratio. (D) H & E staining images of liver tissue sections (each n = 3). Scale bars, 100 μm. Tumor areas in the mock group are marked with lines and indicated by arrows. (E) IHC staining images of VEGF, CD31, CDK2, and CDK4. The present images were photographed in the areas where a tumor was located (each n = 3). (F) The positively stained areas for VEGF, CDK4, CDK2, and CD31 were quantified using ImageJ software. Statistical significance: * (p < 0.05), ** (p < 0.01), and *** (p < 0.001) vs. mock.

