Fig. 2.
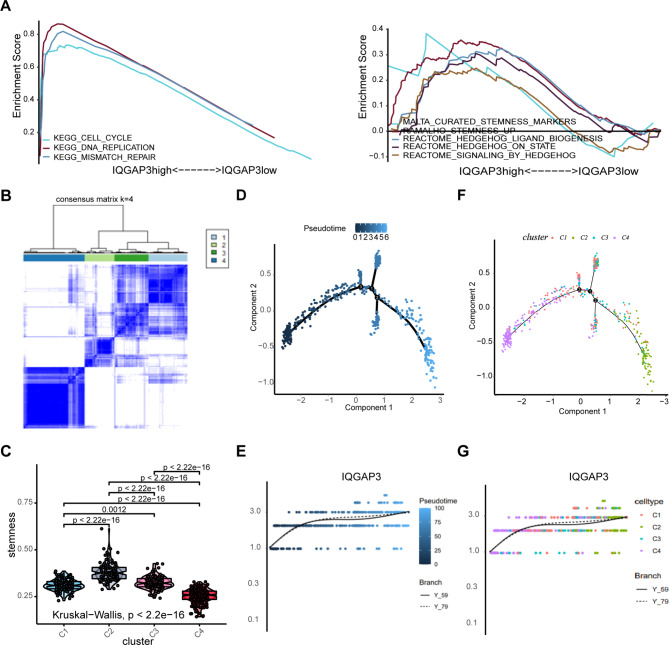
IQGAP3 correlated with stemness of lung cancer. (A) GSEA based on the TCGA database showing the enrichment of gene sets in lung cancer patients with different IQGAP3 expressions. (B) Unsupervised clustering heatmap defining four clusters of lung cancer samples based on the stemness index. (C) The stemness among the four clusters defined by unsupervised clustering. (D-G) Trajectory inference analysis of lung cancer samples. The pseudotemporal trajectory of lung cancer development (D) and IQGAP3 expression pattern from the first differentiation node to the downstream trajectories (E). The distribution of cell clusters defined by unsupervised clustering based on stemness in different branches of lung cancer development (F) and IQGAP3 expression from the first differentiation node to the downstream trajectories in corresponding cell clusters colored in different colors (G).

