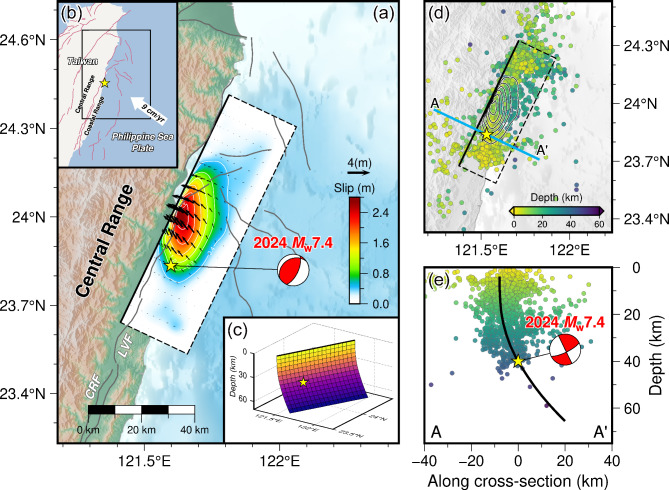
Fig. 1.
(a) Map showing the study area for the 2024 Hualien earthquake. The yellow star indicates the epicenter. The active faults retrieved from Zelenin et al.56 are shown in gray lines, including the Longitudinal Valley fault (LVF) and the Central Range fault (CRF). The slip distribution and the ground projection of our preferred finite-fault model for the Hualien earthquake are shown within the black frame in the map view, with the solid line indicating the top edge. The cumulative moment tensor derived from the joint finite-fault inversion is plotted as the beach ball in red. (b) Map showing the position of the study area for the Hualien earthquake, which is indicated by the black frame. The white arrow represents the convergence direction and rate between the Eurasian and Philippine Sea plates. (c) Our preferred fault model with a listric geometry used for reconstructing the rupture process of the Hualien earthquake. The colors represent the fault dip that decreases gradually from 90° to 45° with the increasing depth. The yellow star indicates the hypocenter. (d) Aftershocks following the mainshock in one month, which are collected from the Taiwan Seismological and Geophysical Data Management System (GDMS), are plotted in circles with the colors corresponding to the focal depths. The blue line is the cross-section A-A’ that is perpendicular to the strike of the seismogenic fault. The black lines represent the contours of the slip distribution. (e) Cross-section A-A’ with the aftershocks projected into it. The black line indicates the fault plane projected into the cross-section. The cumulative moment tensor is also plotted in the side view. The figures were generated by the Generic Mapping Tools 6.3.0 (GMT 6.3.0, https://www.generic-mapping-tools.org).

