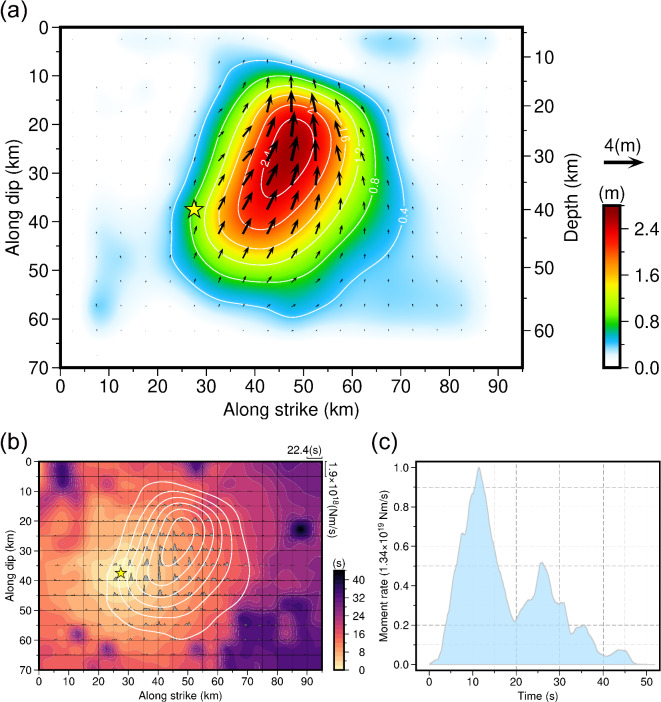
Fig. 2.
Results of the joint finite-fault inversion for the 2024 Hualien earthquake. (a) Slip distribution of the Hualien earthquake, with the slip contours at an interval of 0.4 m. The yellow star indicates the hypocenter. (b) Seismic moment releasing rate functions of the subfaults on the fault plane, with the rupture front propagation shown as the background color and the slip contours plotted as white lines. (c) Total seismic moment releasing rate function of the Hualien earthquake. The figures were generated by the Generic Mapping Tools 6.3.0 (GMT 6.3.0, https://www.generic-mapping-tools.org).

