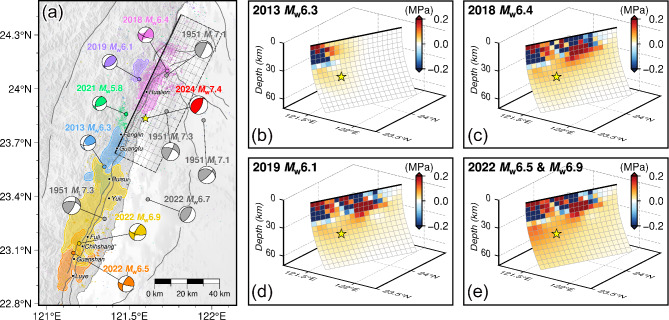
Fig. 4.
(a) Map showing the historical major events along the Longitudinal Valley (LV). The colored areas are the main slip zones of the historical major events6–9. The epicenter locations of the historical events are collected from the GDMS, and the corresponding moment tensor solutions are determined by the U.S. Geological Survey-National Earthquake Information Center (USGS-NEIC). For the four events in the 1951 Longitudinal Valley earthquake sequence, the epicenters and moment tensor solutions are collected from Chen et al.16. The cumulative moment tensor of the 2024 Hualien earthquake is plotted as the beach ball in red. (b–e) Cumulative Coulomb failure stress (CFS) changes induced by the representative historical major events on the seismogenic fault of the 2024 Hualien earthquake after (b) the 2013 Ruisui Mw 6.3 earthquake, (c) the 2018 Hualien Mw 6.4 earthquake, (d) the 2019 Hualien Mw 6.3 earthquake, and (e) the 2022 Chihshang Mw 6.5 and Mw 6.9 earthquakes. The figures were generated by the Generic Mapping Tools 6.3.0 (GMT 6.3.0, https://www.generic-mapping-tools.org).

