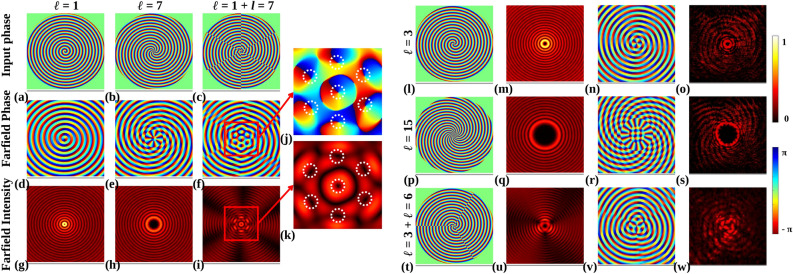
Figure 7.
Input phases with (a)  , (b)
, (b)  and (c) (
 ). (d–f) Calculated farfield phases of respective input phases, (g–i) calculated farfield intensities of respective input phases. (j) Zoomed farfield phase of (f), marked with the red box. (k) Zoomed farfield intensity of (i), marked with the red box. Each intensity null and phase singularity is marked with a white dotted circle. (l,p,t) Input phase of fabricated metasurface:
  ,
,  , and (
 ) respectively. (m,q,u) Respective calculated farfield intensities of input phases. (n,r,v) Respective calculated farfield phases of input phases. (o,s,w) Respective experimental intensities of input phases.

