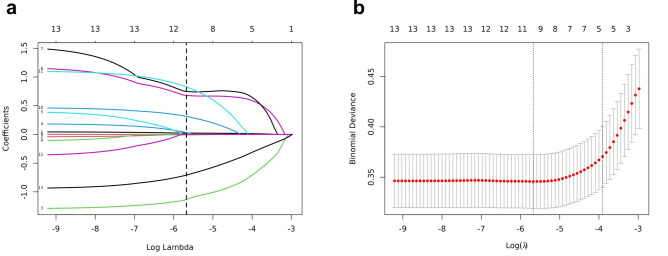
Fig. 1.
Best match factor screening by LASSO regression model. (a) is the LASSO regression path diagram. Each continuous variable is shown as a coloured line; the classification variables are split to dummy variables, and each dummy variable is shown as a coloured line. The vertical dotted line represents the optimal λ, with which eight variables with non-zero coefficients were screened out. (b) is the plot of the best matching factors screened by the tenfold cross validation method, and the best matching factors were selected using lambda.min as the criterion.

