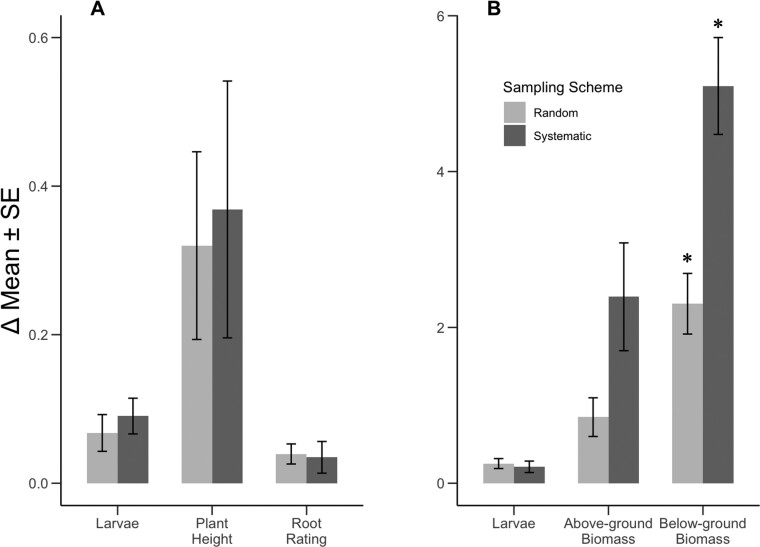
Fig. 4.
Comparisons of mean absolute differences (Δ Mean ± SE) between the true mean and estimated means provided by 30-samples taken using a random vs. systematic sampling scheme (n = 6). (A) Asiatic garden beetle, Maladera formosae Brenske, larval density estimated using a golf course cup-cutter (10 cm depth), plant height (cm), and root rating (1-5 nominal scale). (B) Asiatic garden beetle larval density estimated by excavating a 0.25m2 quadrat of soil (10 cm depth), above-ground biomass (g), and below-ground biomass (g). Asterisks denote estimated means for a particular variable differ significantly between random and systematic sampling schemes (α = 0.05). True means represent estimates provided by sampling each cell in a 64- or 48-cell grid. Total area = 0.2 or 0.15 ha.

