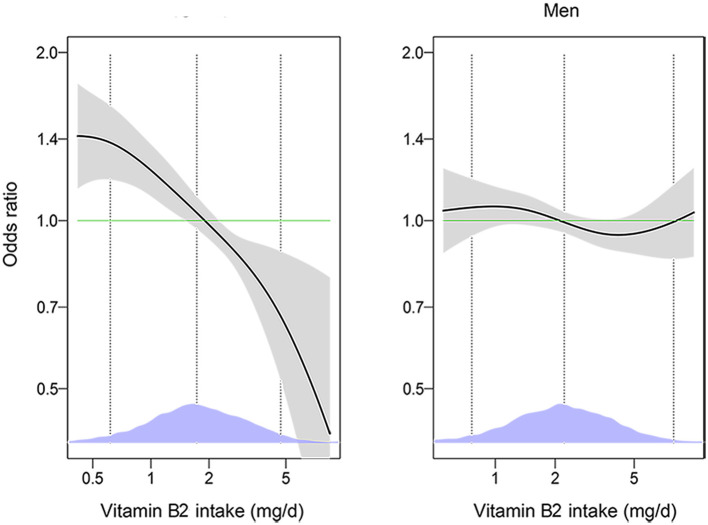
Figure 2.
The associations of vitamin B2 with diabetes among men and women by generalized additive models (n = 18,338). The models were adjusted for age (18–44, 45–59, or ≥60 years), energy intake (continuous), race/ethnicity (Mexican American, other Hispanic, non-Hispanic White, non-Hispanic Black, or other Race-Including Multi-racial), marital status (married/partner, widowed/divorced, or never married), educational level (< high school, high school/GED, or >high school), PIR (< 1 or ≥1), BMI (< 25, 25–29.9, or ≥30 kg/m2), smoking status (every day, some days, or not at all), hypertension (yes or no), hyperlipidemia (yes or no). The solid lines show OR and the shaded areas 95% CI. The dashed lines show OR by linear regression on logarithmic scale. Density plots indicate the distributions of log-transformed vitamin B2 intake, and dotted lines denote the 10, 50, and 90th percentiles. BMI, body mass index; GED, General Educational Development; PIR, ratio of family income to poverty.

