Figure 1.
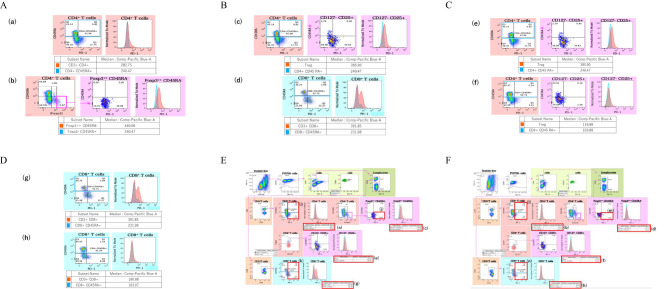
Sample results for the blood flow cytometry analysis in control and TED patients. Results of PD-1 MFI ratio on T cells. (A) It shows MFI ratio of CD4+ T cells, and (a) shows MFI of a TED patient, (b) shows MFI of a control patient. (B) It shows MFI ratio of CD4+ Foxp3 high T cells, and (c) shows MFI of a TED patient, (d) shows MFI of a control patient. (C) It shows MFI ratio of CD4+ CD127- CD25+ T cells, (e) shows MFI of a TED patient, (f) shows MFI of a control patient. (D) It shows MFI ratio of CD8+ T cells, and (g) shows MFI of a TED patient, (h) shows MFI of a control patient. Results of PD-1 expression on T cells in TED patient. (E) (i) shows PD-1 expression of the CD4+ T cells, (j) indicates PD-1 expression of the Foxp3high CD45- T cells, and (k) shows PD-1 expression of the CD8+ T cells in TED patient. Results of PD-1 expression on T cells in control patient. (F) (l) shows PD-1 expression of the CD4+ T cells, (m) indicates PD-1 expression of the Foxp3high CD45- T cells, and (n) shows PD-1 expression of the CD8+ T cells in control patient.

