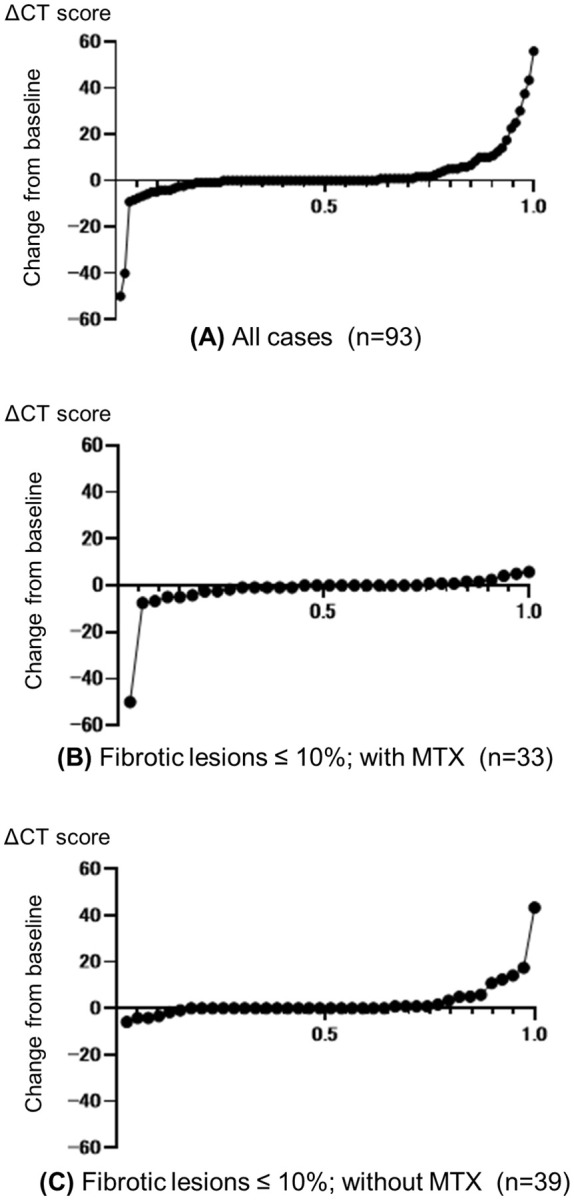
Figure 3.

Cumulative probability plots of change from baseline in CT scores. Change from baseline to follow-up (ΔCT score) for (A) all patients and (B, C) patients with pulmonary fibrosis lesions in ≤10% of the total lung field who were treated with (B) or without (C) concomitant methotrexate (MTX). Circles represent individual patients.
