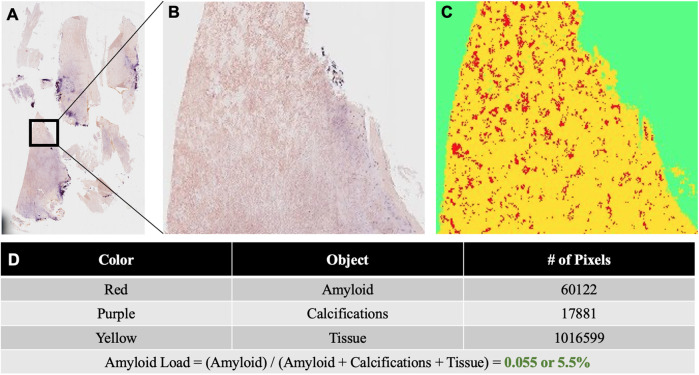
Figure 3.
(A) Congo red stained slide of ligamentum flavum tissue resected at L4–5. The tissue was scanned under non-polarized light and digitized using a VENTANA DP 200 slide scanner (Roche Diagnostics, Rotkreuz, Switzerland) at 20× magnification and one focus layer. (B) Higher magnification of the Congo red stained ligamentum flavum specimen. (C) The results image generated for the quantification of amyloids and other tissue elements using the Trainable Weka Segmentation model. (D) Table displaying the total number of pixels corresponding to amyloids, calcifications, and tissue in the results image. Amyloid load was calculated as the total number of amyloid pixels divided by the sum of all pixels corresponding to amyloids, calcifications, and tissue.

