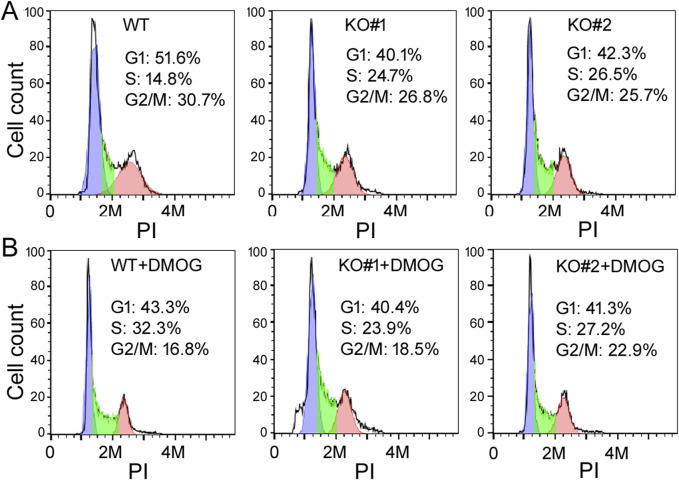
FIGURE 3.
The cell cycle profiles of WT and KO cells under control (A) and DMOG treatments (B). The y-axis is the cell count, the x-axis PI staining that measured DNA content. Representatives of at least three experiments are shown here. The percentages of cells in the G1, S, and G2/M phases were determined automatically by the default settings of the flow cytometry and software and listed inside the graphs.

