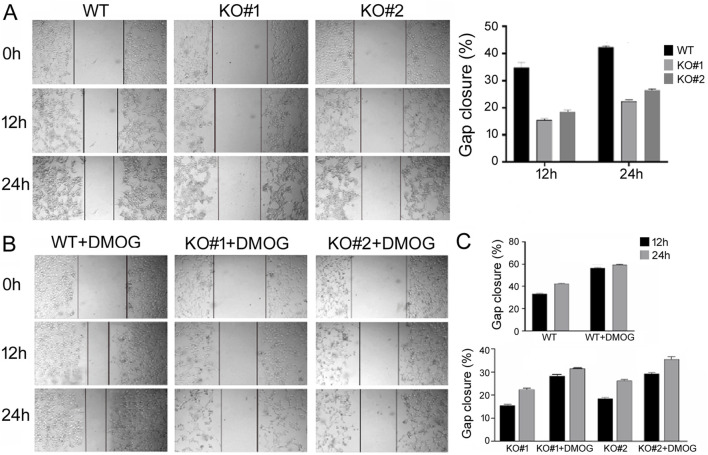
FIGURE 4.
Scratch assays to measure migration of the WT and KO cells. (A) Migration under normoxic condition. Representative cell images are shown, with lines marking the migrating, leading edges of cells. The right panel shows the quantification on gap closure or migration at the 12 h and 24 h time points. Gap closure was defined as one minus the ratio of the gap width at 12 or 24 h vs. that at 0 h when the scratch was made and presented in percentage. Averages and standard deviations are shown. (B) Representative cell images under DMOG treatment. (C) Quantification and comparison of gap closure of the WT and KO cells under normoxic and DMOG conditions. Averages and standard deviations are shown.

