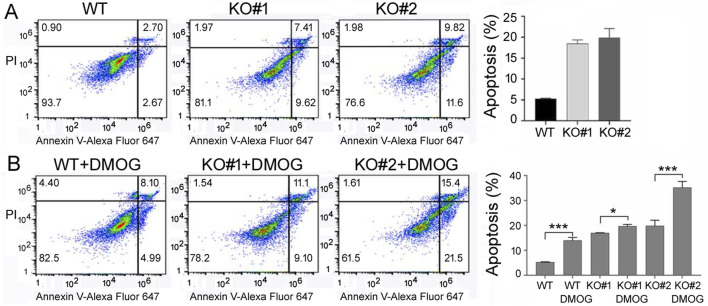
FIGURE 5.
Apoptosis of the WT and KO cells under normoxic (A) and DMOG (B) conditions. PI staining (the y-axis) detected DNA content, and Annexin V staining (the x-axis) examined apoptosis, which was represented by the lower right quadrant, corresponding to early apoptotic cells, and the upper right quadrant, corresponding to late apoptotic cells. Percentages of cells in each quadrant were determined automatically by the default settings of the flow cytometry and software and listed inside the graphs. Right panels show the average and standard deviations of the percentages of total apoptotic cells. *: p < 0.05; ***: p < 0.001.

