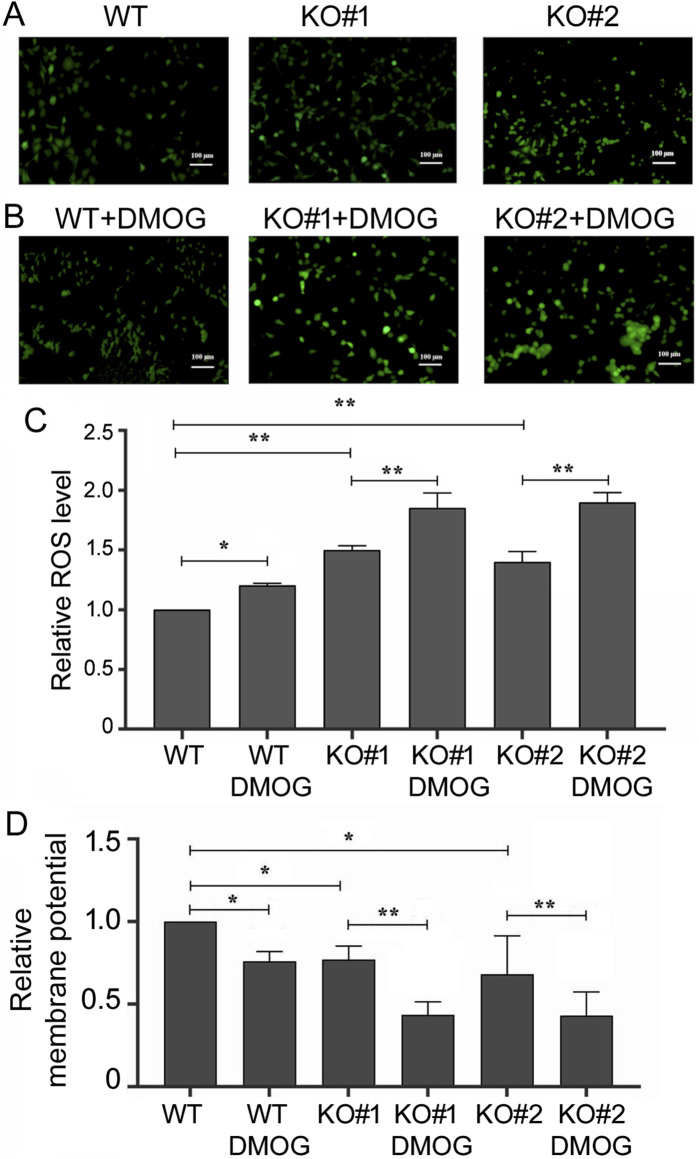
FIGURE 6.
ROS levels and mitochondrial membrane potentials in the WT and KO cells. (A) Cells under normoxic condition after staining with 2,7-Dichlorodi-hydrofluorescein diacetate, which measured ROS levels and emitted green fluorescence. Ruler size is included in the images. (B) Green fluorescence of the cells measuring ROS levels, as in (A), under DMOG treatment. (C) Quantification of relative ROS level (the y-axis) as defined by the intensity of the green fluorescence, with that of the WT cells under normoxic condition set at 1. Averages and standard deviations are shown. *: p < 0.05; **: p < 0.01. (D) Quantification of relative mitochondrial membrane potential (the y-axis), as defined by the intensity of the red fluorescence divided by that of the green fluorescence, after staining with JC-1 and measured by cell flow cytometry automatically. WT cells under normoxic conditions were set at 1. Averages and standard deviations are shown. *: p < 0.05; **: p < 0.01.

