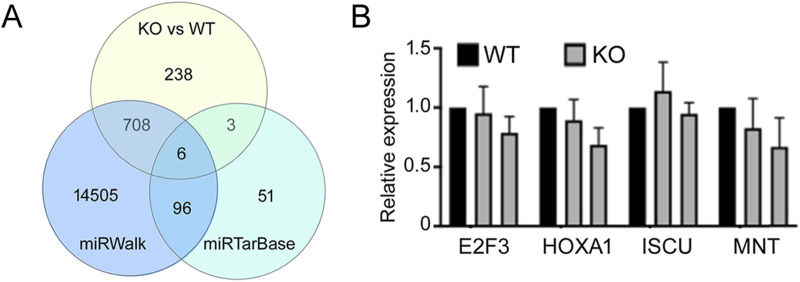
FIGURE 7.
Analyses of miR-210 target genes. (A) Venn diagram of the intersections among genes that had increased expression upon miR-210 KO in 293T cells, miR-210 target genes predicted by miRWalk, and experimentally validated genes according to miRTarBase. (B) qPCR analysis of the indicated mRNAs. Expression in the WT cells was set at 1. Averages and standard deviations are shown. Differences between the WT and KO expression were not significant (p > 0.05).

