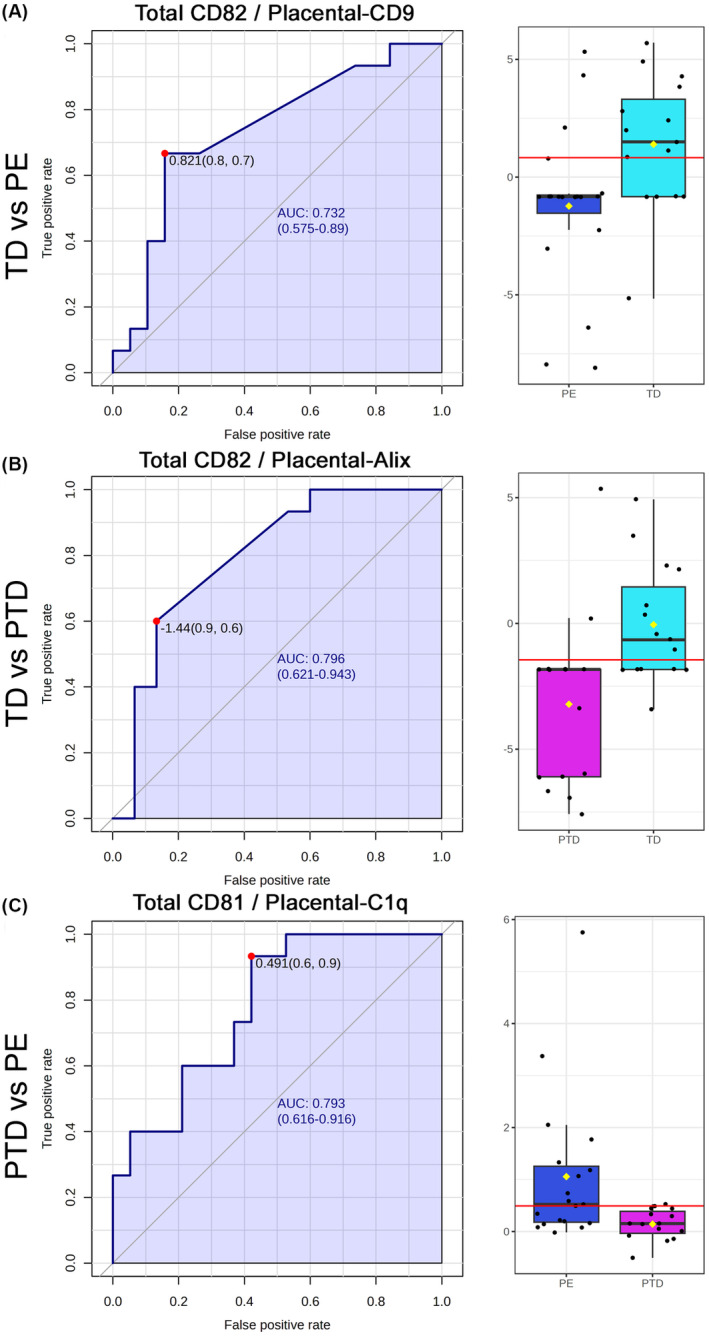
FIGURE 5.

Univariate marker pair for diagnostic prediction of complications. Receiver operating characteristics (ROC) curves and area under the ROC curve (AUROC) are shown to the left for pair of markers from the Total extracellular vesicles (EVs) and the placenta EVs comparing the fluorescent signal ratio of the best pair that differentiate between PE to TD control (A), PTD and TD control (B) and PE and PTD (C). The red dots on the AUROC curve shows the mathematical optimum between sensitivity and specificity. To the right side are Box and Wisker Plots made at this optimum where the red line marks the median, the box showed Inter quartile range (IQR) between the 1st and the 3rd quartile, and the line indicates the 5% and 95% confidence intervals. The respective significance for the differences were p < 0.001, 0.01, and 0.05 for PE vs TD control, PTD vs TD control, and PE vs PTD, respectively.
