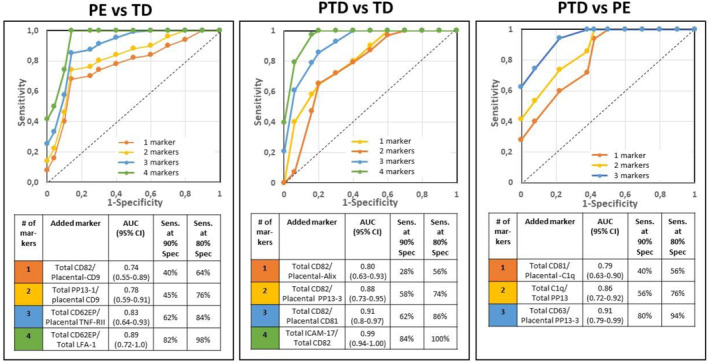
FIGURE 6.

Combined marker analysis of prediction pregnancy complications. Top: Receiver Operating Characteristic (ROC) curve made of the sensitivity and the specificities of univariate and multiple pairs of total and placental surface markers. Bottom: The calculated area under ROC curve (AUROC), and its respective sensitivities at 90% and 80% specificities shows the added value of adding each pair. Left: PE vs TD control, Middle: PTD vs TD control, and Right: PE vs PTD. Marker nature is provided in Table 1.
