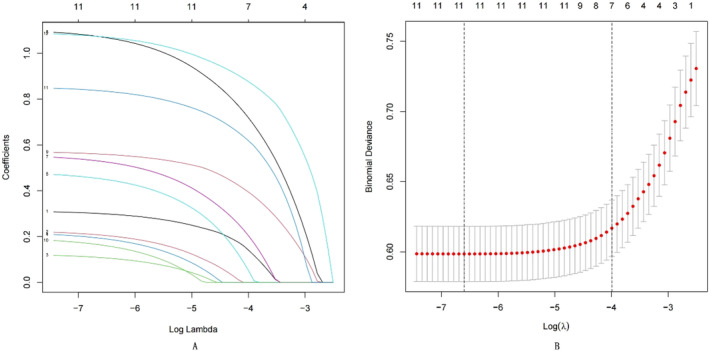
FIGURE 2.

(A) The feature selection was used for LASSO. LASSO coefficient profiles of the 12 features. Coefficient profiles were plotted based on the log(λ) series. (B) The x‐axis represents the logarithmic value of lambda, the y‐axis represents mean square error (MSE), and the values above the graph represent the number of independent variables. The two vertical dashed lines represent the logarithmic values of lambda corresponding to the minimum mean square error and the lambda value corresponding to one standard error away from the minimum mean square error. The optimal λ produced 11 features with non‐zero coefficients.
