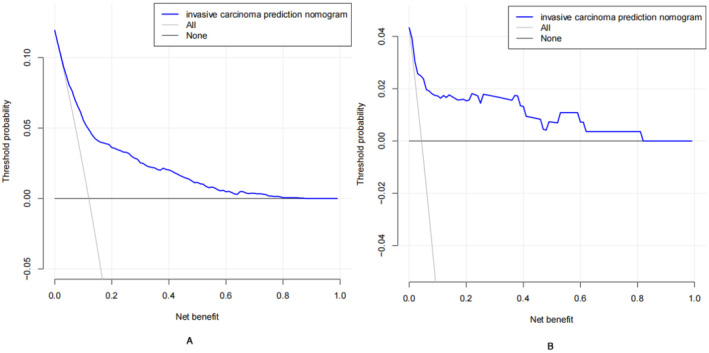
FIGURE 5.

Decision curve analysis (DCA) for invasive cancer nomogram. (A) The DCA curve is in the transverse range from 0.01 to 0.87, the DCA curve lies above the None and All null lines, indicating that the model is moderately effective in this range; in the range of less than 0.1 or greater than 0.87, the DCA curve is close to the None and All null lines, indicating that the model is less effective in this range. (B) The external validation set.
