. 2024 Oct 30;104(1):130–138. doi: 10.1111/aogs.14999
© 2024 The Author(s). Acta Obstetricia et Gynecologica Scandinavica published by John Wiley & Sons Ltd on behalf of Nordic Federation of Societies of Obstetrics and Gynecology (NFOG).
This is an open access article under the terms of the http://creativecommons.org/licenses/by-nc-nd/4.0/ License, which permits use and distribution in any medium, provided the original work is properly cited, the use is non‐commercial and no modifications or adaptations are made.
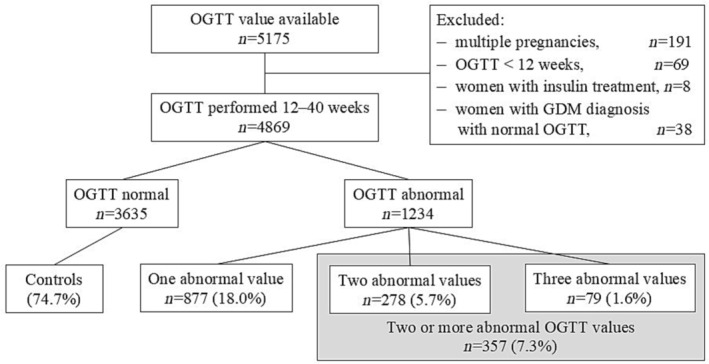
FIGURE 1.

Flow chart of the study.
