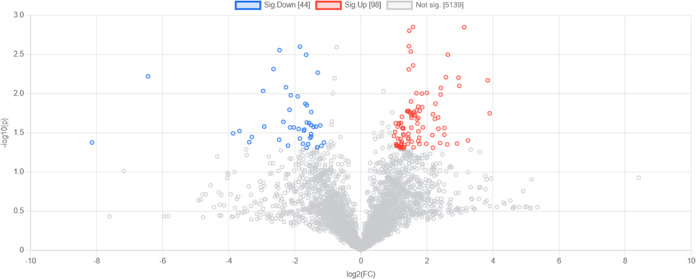
Figure 7.
Volcano plot illustrates the fold changes in metabolites associated with the influent and effluent of the underground reservoirs, represented by p-values. Red dots indicate an increase in metabolites within the outflow samples, whereas blue dots denote a decrease in metabolites (p < 0.05, FC > 1.5). The threshold for screening differential metabolites was set at FDR < 0.05.

