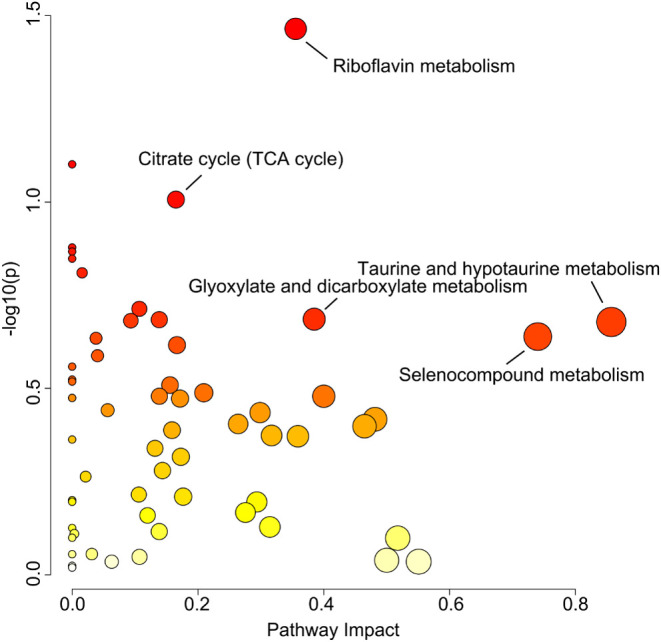
Figure 8.

Advantageous metabolic pathways enriched in the underground water reservoir. The horizontal axis represents the impact size of the metabolic pathways. The deeper the color of the bubble, the stronger the significance of the metabolic pathway. The larger the bubble, the more metabolites are enriched in that metabolic pathway.
