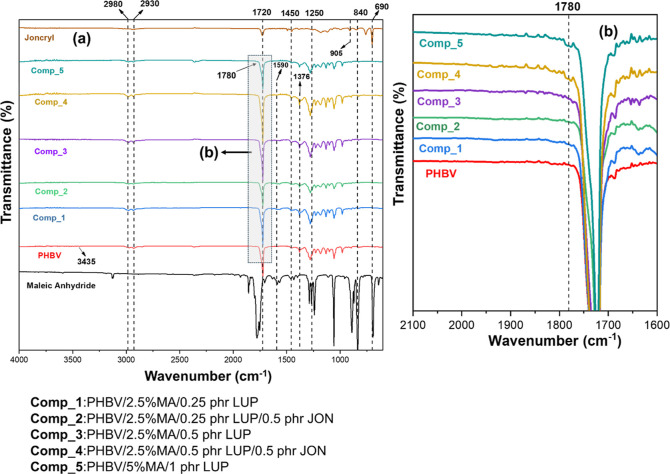
Figure 4.
(a) FTIR spectra of PHBV, purified MA-g-PHBV samples, JON, and MA. (b) The highlighted region from Figure 4a (2000–1600 cm–1) is expanded, in which Comp_4 and Comp_5 are showing small peak at 1780 cm–1. This peak indicates the grafting of MA onto the PHBV backbone, associated with the succinic anhydride group of MA, and is absent in neat PHBV. [For other samples, the peak at 1780 cm–1 was absent due to lower grafting percentage]. Additionally, the FTIR spectra have been brought closer along the Y axis in Figure 4b using Origin software to enhance clarity and make it easier to distinguish between the peaks in the spectra.

