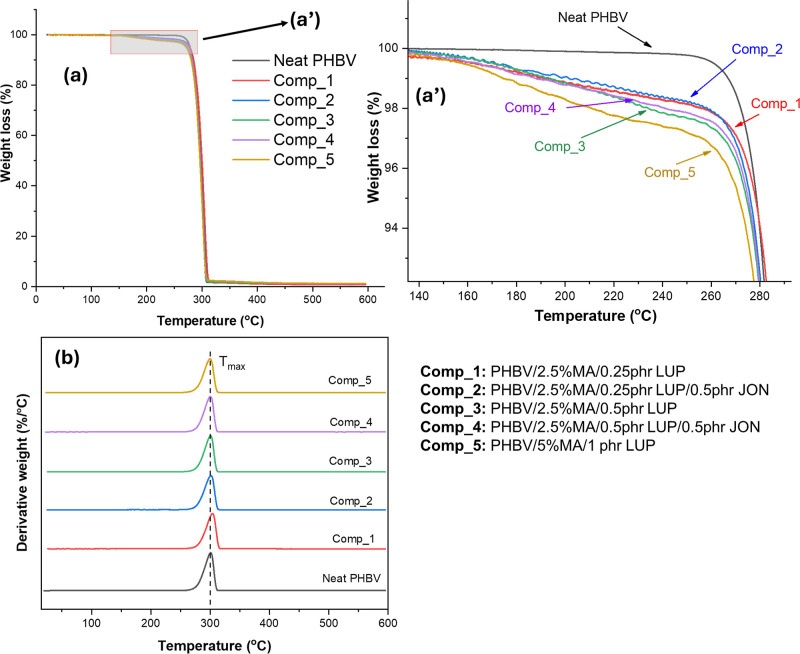
Figure 7.
Thermal stability trend in PHBV and maleated PHBV; (a) mass loss behavior of different samples; (a′) focused area of mass loss curve; (b) derivative weight graph of PHBV and maleated PHBV (the dotted lines were added to compare the Tmax of maleated PHBV). The T2% of the maleated PHBV was enhanced after the inclusion of JON compared to its counterpart without JON. The highest T2% value was observed for Comp_2, while Comp_5 was the lowest. As such, JON helped enhance the thermal stability of the maleated PHBV.

