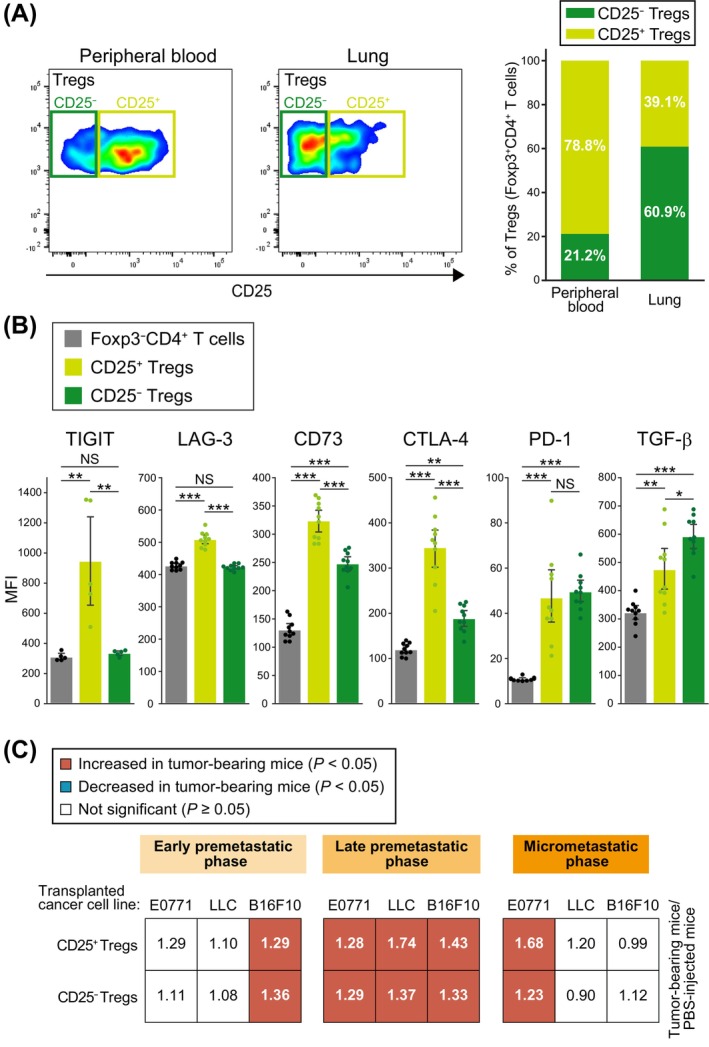
FIGURE 3.

Both CD25− Tregs and CD25+ Tregs accumulate in the lungs during the late premetastatic phase. (A) Representative flow cytometric analysis of CD25 expression in Tregs (Foxp3+CD4+ T cells) of peripheral blood or lung of control mice (left). Percentage of CD25+ or CD25− cells among Tregs (right). Data are means from 5 mice. (B) Flow cytometric quantification of TIGIT, LAG‐3, CD73, CTLA‐4, PD‐1, and TGF‐β expression in Tregs and Foxp3−CD4+ T cells isolated from the lung of control mice. MFI, mean fluorescence intensity. Data are means +95% confidence interval (n = 5 to 10 mice). *p < 0.05, **p < 0.01, ***p < 0.001; NS, not significant (Tukey–Kramer test). (C) Summary of changes in the numbers of CD25+ Tregs and CD25− Tregs in the lung during premetastatic to early metastatic phases. Significant (p < 0.05) increases or decreases relative to PBS‐injected mice are indicated by red and blue squares, respectively (unpaired two‐sided Student's t test or Tukey–Kramer test). The numbers in the squares indicate the ratio of the percentage of each cell type among viable cells for mice injected with cancer cell lines to that for PBS‐injected mice and were derived from 8 to 34 mice.
