
FIGURE 4.
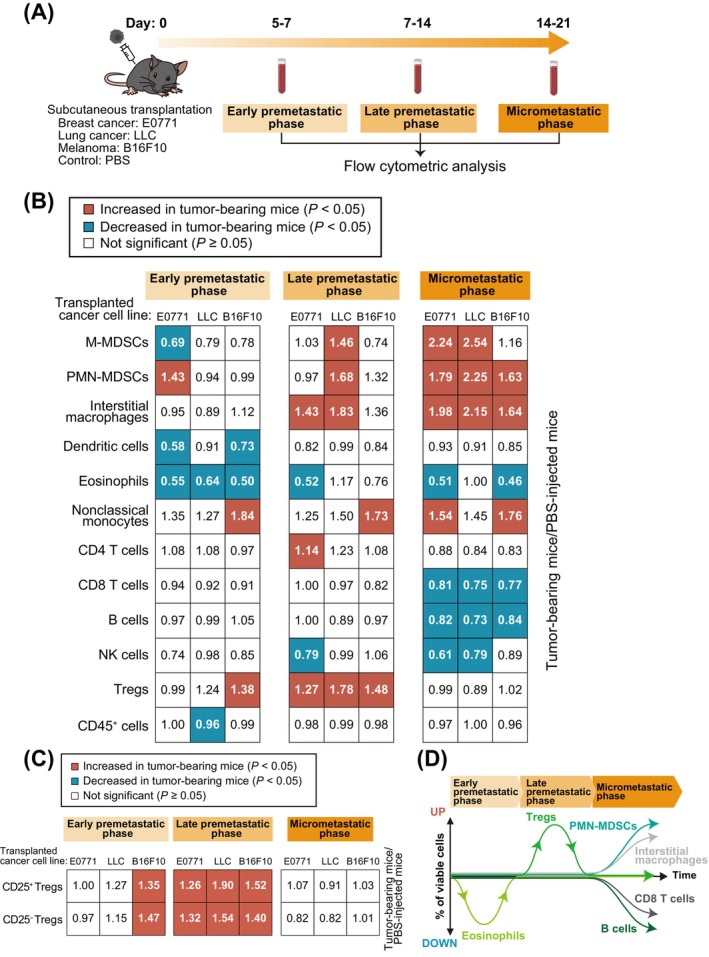
Changes in immune cell composition associated with metastasis for peripheral blood are similar to those for lung. (A) Schematic representation for flow cytometric analysis of immune cells from peripheral blood of tumor‐bearing mice. Mice were injected in the fourth mammary fat pad or the right back with E0771, LLC or B16F10 cells or with PBS (control), and peripheral blood was collected from the right ventricle of mice before perfusion at 5–21 days. (B) Summary of changes in immune cell composition for peripheral blood during premetastatic to early metastatic phases. Significant (p < 0.05) increases or decreases relative to PBS‐injected mice are indicated by red and blue squares, respectively (unpaired two‐sided Student's t test or Tukey–Kramer test). The numbers in the squares indicate the ratio of the percentage of each cell type among viable cells for tumor‐bearing mice to that for PBS‐injected mice (n = 4 to 29 mice). (C) Summary of changes in the numbers of CD25− Tregs and CD25+ Tregs in peripheral blood from premetastatic to early metastatic phases. Significant (p < 0.05) increases relative to PBS‐injected mice are indicated by red squares (unpaired two‐sided Student's t test or Tukey–Kramer test). The numbers in the squares indicate the ratio of the percentage of each cell type among viable cells in tumor‐bearing mice to that in PBS‐injected mice (n = 6 to 20 mice). (D) Summary of the dynamics of immune cell types in peripheral blood showing a decrease in the number of eosinophils in the early premetastatic phase, an increase in Tregs in the late premetastatic phase, and an increase in PMN‐MDSCs and interstitial macrophages and a decrease in B cells and CD8 T cells in the micrometastatic phase.