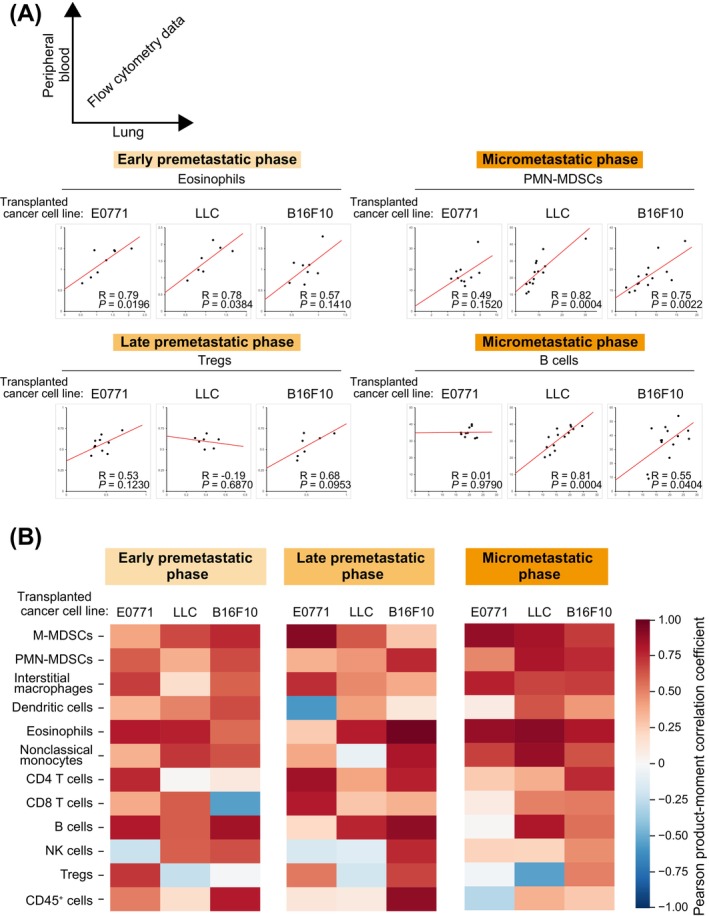
FIGURE 5.

Correlation of immune cell changes in peripheral blood with those in the lung for the mouse models of metastasis. (A) Scatter plots for the percentage of the indicated immune cell types in peripheral blood (vertical axis) versus that in lung (horizontal axis) for the indicated premetastatic to early metastatic phases. Red lines represent the approximate straight lines. The correlation coefficient (R) is shown (n = 7 to 14 mice). (B) Heat map of Pearson product–moment correlation coefficients for lung immune cells versus peripheral blood immune cells (n = 7 to 14 mice).
