Figure 3.
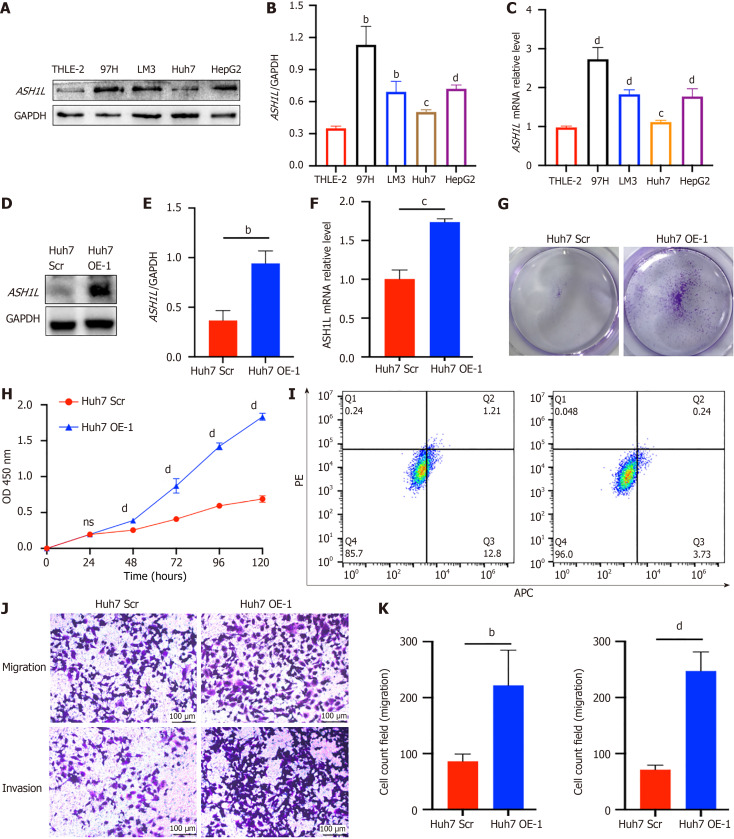
ASH1L expression in different cell lines, the establishment of overexpression cell lines and proliferation assay, migration, and invasion assay of Huh7-ASH1L-overexpression. A: Western blot analysis was performed to assess ASH1L protein expression in both normal liver cells and a range of hepatocellular carcinoma (HCC) cell lines; B: A quantitative analysis of the western blot data provided a numerical representation of ASH1L expression levels in the liver and HCC cell lines; C: Quantitative real-time polymerase chain reaction (RT-qPCR) analysis was conducted to evaluate the transcriptional levels of ASH1L in liver cells and various HCC cell lines, offering insights into gene expression patterns; D: Western blot analysis was used comparing the protein levels between Huh7 scrambled (Scr) and overexpression (OE) groups; E: The quantitative results of the western blot analysis provided a statistical comparison of ASH1L protein levels between the Huh7 Scr and OE groups; F: RT-qPCR analysis was also performed to compare the ASH1L gene expression between the Huh7 Scr and OE groups, quantifying the effect of overexpression on the transcriptional level; G: A colony formation assay was carried out to determine the effect of ASH1L overexpression on the clonogenic capacity of the cells; H: Cell counting kit 8 assays were conducted to assess the proliferative activity of the cells, with results indicating the impact of ASH1L overexpression on cell growth; I: Cell apoptosis was detected by flow cytometry, and the results showed the influence of ASH1L overexpression on apoptosis; J: Transwell chamber assays were used to evaluate the migratory and invasive capabilities of the cells, highlighting the differences between the Huh7 Scr and OE groups; K: Quantitative analyses of the Transwell assay data provided a statistical comparison of the cell migration and invasion abilities between the Huh7 Scr and OE groups, further elucidating the role of ASH1L in these cellular processes. aP < 0.05. bP < 0.01. cP < 0.001. dP < 0.0001. GAPDH: Glyceraldehyde-3-phosphate dehydrogenase; Scr: Scrambled; OE: Overexpression; APC: Allophycocyanin conjugate; PE: Phycoerythrin.

