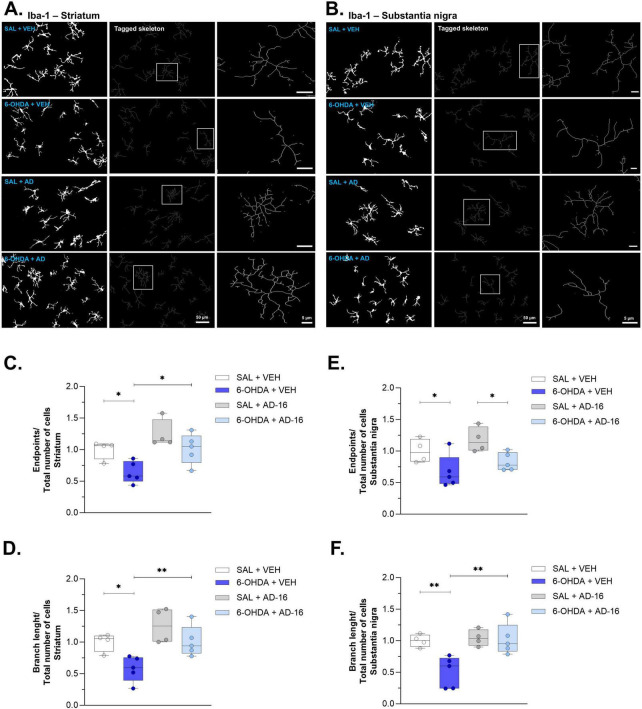
FIGURE 5.
Iba -1 skeleton analysis results. Representative grayscale, tagged skeleton, and zoomed cell from the Skeleton analysis performed in the striatum (A). Graphs of microglia endpoints/cell and branch length/cell, respectively, in the striatum (SAL + VEH and SAL + AD-16: n = 4; 6-OHDA + VEH and 6-OHDA + AD-16: n = 5) (C,D). Representative grayscale, tagged skeleton, and zoomed cell from the Skeleton analysis performed in the substantia nigra (B). Graphs of microglia endpoints/cell and branch length/cell, respectively, in the substantia nigra (SAL + VEH and SAL + AD-16: n = 4; 6-OHDA + VEH and 6-OHDA + AD-16: n = 5) (E,F). Scale bars in the second column represent 50 μm. Scale bars in the third column (zoom image) represent 5 μm. Data expressed as mean ± SEM.*p < 0.04; **p < 0.005.

