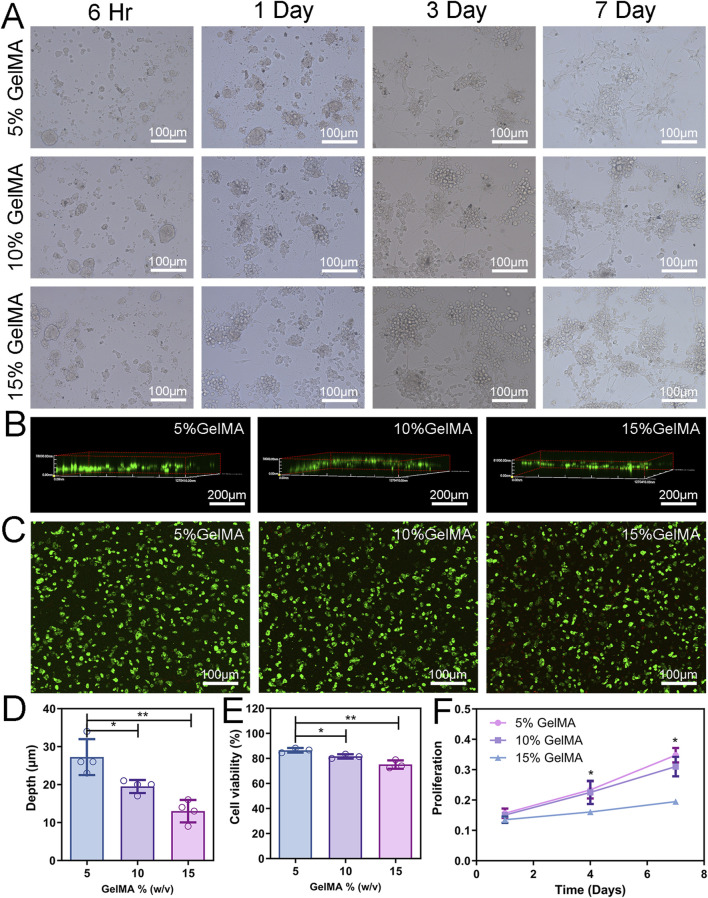
FIGURE 3.
2D Cell co-culture and 3D cytocompatibility. (A) Cell morphology of NSCs and BMSCs co-cultured on the hydrogel surface with different concentrations. (B) LSCM was used to observe the depth of cells entering the scaffold. (C) The activity of co-cultured cells in the hydrogel was detected by Calcein-AM/PI staining. Green fluorescence (AM) indicates viable cells and red fluorescence (PI) indicates dead cells. (D) Analysis of cell migration depth. (E) Assessment of cell viability. (F) Proliferation of cells encapsulated in different concentrations of hydrogels. (n = 3; *p < 0.05, **p < 0.01).

