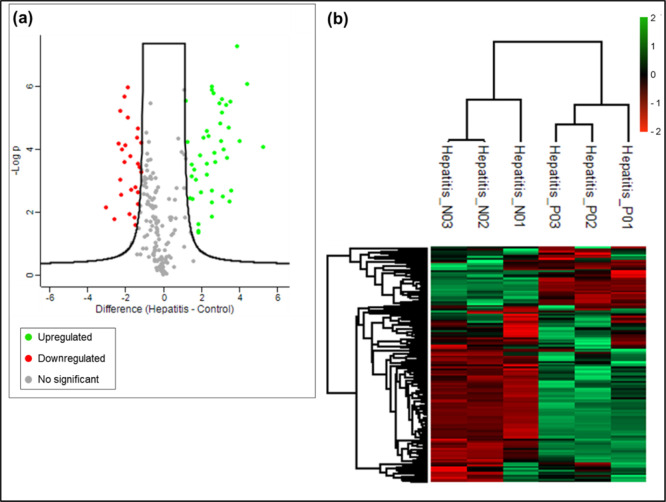
Figure 1.
(a) Volcano plot. Distribution of DEPs with greater significance was compared between test and control samples. On the x-axis, we used log2 of Folder charge and on the y-axis −log10 p-value. (b) Heat map of DEPs, showing upregulated (z-score values: from 0 to 2) and downregulated (z-score values: from 0 to −2) proteins. Non-HepA-E hepatitis (positive) replicates: P01, P02, and P03. Control (negative) replicates: N01, N02, and N03.

